New Bedford Harbor Cleanup Plans, Technical Documents and Environmental Data
You will need Adobe Reader to view some of the files on this page. See EPA's About PDF page to learn more.
On this page:
- Current Work
- Site Description and History
- Annual Seafood Monitoring
- EPA Harbor Dredging
- State Enhanced Remedy
- Additional Long Term Monitoring Activities
- Outer Harbor Study
- Earlier Cleanup Actions
- New Bedford Harbor Five Year Reviews
- Other Relevant Documents
Second page:
Third page:
Areas dredged to date
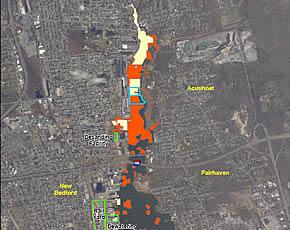
Map of cleanup areas (PDF) (1 pg, 365 K)
Current / Anticipated Work in 2013
Over the 2012 cleanup season, EPA successfully removed 17,275 tons (over 20,000 cubic yards) of contaminated material from about 6 acres of New Bedford Harbor. There were 52 days of active hydraulic dredging Exit in the Upper Harbor. To date, about 230,357 cubic yards has been removed. This is roughly 25% of the total anticipated volume of contamination targeted in EPA’s 1998 Cleanup Plan which consists of the 1998 Record of Decision (ROD) and four subsequent Explanation of Significant Differences (ESDs).
CAD Cell Design
EPA anticipates completing the design of the lower harbor Confined Aquatic Disposal Cell (LHCC) by the end of 2012. The project will then be put out to bid by the City of New Bedford Harbor Development Commission (HDC). This work will consist of digging a CAD cell in the lower harbor with a capacity of about 300,000 cubic yards to hold PCB contaminated material from the lower harbor, and a small portion of the upper harbor. If all goes as planned, EPA hopes to begin dredging contaminated sediments to be placed into the newly constructed LHCC during the second half of 2013
Outer Harbor Study
The Outer Harbor (Operable Unit # 3), which consists of approximately 17,000 acres outside of and adjacent to the New Bedford Hurricane Barrier, is currently undergoing a Remedial Investigation/Feasibility (RI/FS) Study. This study includes field sampling to determine the nature and extent of contamination, conducting human health and ecological risk assessments, a review of technologies and range of response actions to address any risks that are found. Completion of the RI/FS for the outer harbor is scheduled for completion in late 2013. EPA will continue to keep the public informed about the progress of the outer harbor study at the public meetings.
How does hydraulic dredging work?
The current hydraulic, or full-scale dredging process, removes contaminated sediment from the harbor bottom by a vacuum-like system of dredges, pipelines and processing facilities. Before areas are hydraulically dredged, any large debris such as tires, mounds of bricks, etc are removed from the harbor bottom to avoid any damage to the equipment. Once the areas have been cleared, the hydraulic dredge pumps water and sediment through an underwater pipeline to EPA's de-sanding facility Exit on Sawyer Street in New Bedford. The coarse sand and shells are filtered from the sediment and silt that contain most of the PCB contamination. The filtered coarse material is temporarily stored and tested at Sawyer Street before it is sent to an off-site, licensed disposal. The remaining silt and water is pumped 1.4 miles south to EPA's de-watering facility Exit, where large filter presses squeeze water from the silt. EPA treats the water Exit to strict water quality standards before it is released back into the harbor, while the packed sediment is safely transported to a licensed PCB landfill in Michigan.
- Following the discovery of a shipwreck in 2009, as well as an anchor of possible historic value in late 2010, archaeological surveys are conducted as necessary and an "on-call" marine archaeologist is available should additional artifacts be uncovered during the cleanup work.
During active cleanup work, EPA monitors the air and water quality Exit to ensure that environmental quality is not impacted and that the cleanup continues to be protective for the workers and surrounding communities. Additionally, EPA is working with the adjacent cities and towns to ensure that fishing restrictions and exposure risks continue to be communicated to the public.
Site Description and History
The 18,000-acre New Bedford site is an urban tidal estuary with sediments which are highly contaminated with polychlorinated biphenyls (PCBs) and heavy metals. At least two manufacturers in the area used PCBs while producing electric devices from 1940 to the late 1970s, when the manufacture of PCBs was banned by the EPA. These facilities discharged industrial wastes containing PCBs directly into the harbor and indirectly through the city sewer system. As a result, the harbor is contaminated in varying degrees for at least 6 miles from the upper Acushnet River into Buzzards Bay. Over 100,000 people live within 3 miles of the site.
This site is being addressed in four stages: initial actions and three long-term remedial phases focusing on the hot spot area, the upper and lower harbor areas, and the outer harbor Buzzards Bay area.
When the cleanup began, the areas with the highest levels of PCBs were addressed first. A 5-acre northern portion of the Acushnet River estuary was identified as the "hot spot" area and addressed prior to the start of the full scale dredging in the upper and lower harbor that has been underway since 2004. Studies for the nature and extent of contamination in the outer harbor are under way.
Environmental monitoring results indicate that tidal action transports up to 0.5 pounds of PCBs from the upper harbor to the lower harbor each day. Recent monitoring at the Hurricane Barrier indicates that 95 pounds move from within the harbor to Buzzards Bay each year.
Bioaccumulation of PCBs within the marine food chain has resulted in closing the area to lobstering and fishing, and recreational activities and harbor development have been limited by the widespread PCB problem. Since 1982, signs warning the public of the presence of PCBs in the harbor have been in place and maintenance and replacement of these continue as needed.
Annual Seafood Monitoring
To ensure that the there is adequate information about the levels of PCBs in locally caught seafood, EPA monitors data collected each year by the Massachusetts State Department of Environmental Protection. Multiple sample areas in and around New Bedford Harbor are revisited each year to collect good comparable data. Multiple samples of locally found fish and shellfish are studied each year to see if the cleanup work is having an impact on PCB levels, and to ensure that the public has the most up to date information on which fish are not safe to eat.
EPA Locally Caught Seafood Guidance
Annual Seafood Monitoring Reports:
- Contaminant Monitoring Report for Seafood Harvested in 2014 from the New Bedford Harbor Superfund Site, August 2015
- Contaminant Monitoring Report for Seafood Harvested in 2013 from the New Bedford Harbor Superfund Site, June 2014
- Contaminant Monitoring Report for Seafood Harvested in 2012 from the New Bedford Harbor Superfund Site, October 2015 (Amended)
- Contaminant Monitoring Report for Seafood Harvested in 2011 from the New Bedford Harbor Superfund Site, August 2012 (PDF) (156 pp, 8 MB)
- Contaminant Monitoring Report for Seafood Harvested in 2010 from the New Bedford Harbor Superfund Site, February 2011 (PDF) (125 pp, 10.5 MB)
- Contaminant Monitoring Report for Seafood Harvested in 2009 from the New Bedford Harbor Superfund Site, October 2010 (PDF) (79 pp, 5 MB)
- Contaminant Monitoring Report for Seafood Harvested in 2008 from the New Bedford Harbor Superfund Site, July 2010 (PDF) (64 pp, 4.6 MB)
- Contaminated Monitoring Report for Seafood Harvested in 2007 from the New Bedford Harbor Superfund Site, September 2009 (PDF) (93 pp, 2.4 MB)
- Contaminant Monitoring Report for Seafood Harvested in 2006 from the New Bedford Harbor Superfund Site, July 2010 (PDF) (92 pp, 3.7 MB)
- Contaminated Monitoring Report for Seafood Harvested in 2005, June 2008 (Revised February 2010) (PDF) (105 pp, 2.8 MB)
- Contaminant Monitoring Report for Seafood Harvested in 2004 from the New Bedford Harbor Superfund Site, July 2010 (PDF) (89 pp, 2.3 MB)
- Contaminant Monitoring Report for Seafood Harvested in 2003 from the New Bedford Harbor Superfund Site, July 2010 (Corrected January 2013) (PDF) (71 pp, 2.4 MB)
- Contaminant Monitoring Report for Seafood Harvested in 2002 from the New Bedford Harbor Superfund Site, June 2004 (PDF) (48 pp, 1.5 MB)
EPA Harbor Dredging
EPA has been performing hydraulic dredging of the harbor since 2004. This dredging process removes contaminated sediment and silt from the harbor bottom through a vacuum like network of the dredges, pipelines and filtration facilities. After being de-sanded to remove shells and coarser sand material, and dewatered to remove the excess water, the remaining hard packed contamination is shipped offsite for licensed disposal in Michigan. Through this and all other cleanup work, EPA maintains rigorous environmental monitoring efforts to ensure the project progresses safely for workers and surrounding communities.
Environmental Monitoring Data
While the risk from the consumption of contaminated fish and shellfish is one of EPA's greatest concerns at this Superfund site, we continue to take all other potential environmental and public health impacts seriously. The reports and data provided here for air, water and sediment quality, help EPA track the cleanup progress and ensure that the work is protective of public health and the environment.
- Final 2012 Fish Migration Impact Plan (PDF) (20 pp, 2.9 MB)
EPA performs air monitoring during the active cleanup of New Bedford Harbor to confirm that the dredging, de-sanding, de-watering or water treatment operations do not cause elevated levels of airborne PCBs that could pose an unacceptable risk to public health. To date all of the results during the hydraulic dredging operations have been well below risk based levels of concern.
See the typical cleanup season air monitoring locations around the harbor.
- Air Monitoring Data Status as of November 2016 (PDF) (4 pp, 1.3 MB)
- November 9, 2015 Ambient Air Status for Manomet Station #25 (PDF)(3pp, 908 K)
- Draft Final Ambient Air Monitoring Plan, July 2015
- 2014 Ambient Air Monitoring Data for 1999-2013
- 2012 Air Monitoring Data, October 2012 (PDF) (2 pp, 604 K)
- 2011 Summary of Ambient Air Monitoring Data for PCBs (PDF) (2 pp, 889 K)
- Summary of Ambient Air Monitoring Data for PCBs from 2004 to 2010
- Table G-1 Validated through 07/20/2010 (PDF) (1 pg, 44 K)
- Ambient Air Sampling Locations (PDF) (1 pg, 259 K)
- Cleanup Action Specific Air Quality Monitoring
- Mechanical Sediment Excavation at the Former Aerovox Facility Shoreline
- Air Monitoring Results Aerovox Excavation 2008 - July 14, 2008 through July 18, 2008 (PDF) (2 pp, 2 K)
- Air Monitoring Results Aerovox Excavation 2008 - July 7, 2008 through July 11, 2008 (PDF) (2 pp, 99 K)
- Air Monitoring Results Aerovox Excavation 2008 - June 30, 2008 through July 04, 2008 (PDF) (2 pp, 40 K)
- Air Monitoring Results Aerovox Excavation 2008 - June 23, 2008 through June 27, 2008 (PDF) (2 pp, 96 K)
- Air Monitoring Results Aerovox Excavation 2008 - May 29, 2008 through June 20, 2008 (PDF) (7 pp, 30 K)
- Aerovox Air Sampling Stations Locations (PDF) (1 pg, 194 K)
- Other Air Monitoring Efforts
- Sawyer Street Air Sampling Stations Locations (PDF) (1 pg, 218 K)
- Air Monitoring During Full Scale Dredging (Fall 2004) - New Bedford Harbor Superfund Site
- Air Monitoring During Construction of Marine Bulkhead along Hervey Tichon Avenue, New Bedford
- Air Monitoring During PCB Sediment Cleanup of Acushnet River in Wood / Slocum Street Area, New Bedford & Acushnet
- Mechanical Sediment Excavation at the Former Aerovox Facility Shoreline
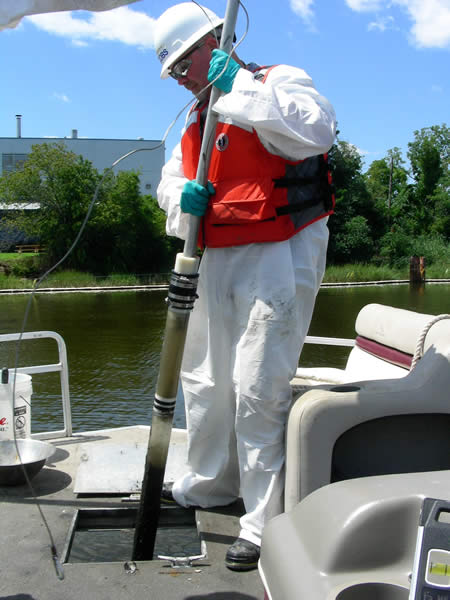
The water quality of New Bedford Harbor is monitored one-week before dredging starts to determine existing conditions, as well as during cleanup work. EPA studies water quality to check for potential unintended impacts and to verify that the cleanup work is not creating conditions which could cause toxicity to marine organisms, contaminant movement or interference with seasonal bird and fish migrations within the Acushnet River and harbor.
Environmental scientists monitor water quality by: (i) boat-based measurement of turbidity and documenting fish and wildlife passage close to the dredge activity and further away, (ii) collecting stationary monitoring data from moored water quality sensors to supplement the boat-based monitoring, and (iii) collecting water samples to test the physical, chemical, and biological conditions in the harbor to verify the protectiveness of the project-based cleanup goals.
- Water Quality Monitoring Program - Turbidity Data for the Lower Harbor, November 2016 (PDF) (6 pp, 667 K)
- Draft Final Sediment Monitoring Summary Report, 2014 Remedial Dredging Season OU1, June 2015
- Draft Final Water Quality Monitoring Summary Report, 2014 Remedial Dredging, OU1, April 2015
- Final Water Quality Monitoring Summary Report, 2013 Remedial Dredging, OU1, August 2014
- Water Quality Monitoring Summary Report, 2012 Remedial Dredging (PDF) (950 pp, 48.4 MB)
- Water Quality Monitoring Summary Report, 2011 Remedial Dredging (PDF) (1,008 pp, 19.5 MB)
- Water Quality Monitoring Summary Report, 2010 Remedial Dredging (PDF) (pp 4 - 414 of 2,960 pp, 107 MB)
- Water Quality Monitoring Summary Report, 2009 Remedial Dredging (PDF) (80 pp, 4.7 MB)
- Appendix A (PDF) (181 pp, 10.3 MB)
- Appendix B (PDF) (16 pp, 2.1 MB)
- Appendix C (PDF) (91 pp, 859 K)
- Appendix D (PDF) (181 pp, 8.4 MB)
- Water Quality Monitoring Summary Report, 2008 Remedial Dredging (PDF) (50 pp, 2.4 MB)
- Appendix A (PDF) (45 pp, 5.9 MB)
- Appendix B (PDF) (13 pp, 234 K)
- Appendix C (PDF) (64 pp, 1.2 MB)
- Appendix D (PDF) (28 pp, 1.4 MB)
- Appendix E (PDF) (124 pp, 5.6 MB)
- Water Quality Monitoring Summary Report - 2007 Remedial Dredging (PDF) (63 pp, 9.5 MB)
- Appendices A- E (PDF) (338 pp, 21.8 MB)
- Water Quality Monitoring Summary Report - 2006 Remedial Dredging (PDF) (310 pp, 10.8 MB)
EPA collects additional information about sediment that may move through the water from natural events such as currents and tidal flow, or man-made activity such as boating or dredging. When the sediment settles back down on the harbor bottom it can be trapped and monitored to determine its amount and potential concentration of PCBs. Sediment trap samples are collected during active dredging periods and during the de-mobilization of dredge-related equipment.
- Sediment Trap Study Summary Report, 2010 Remedial Dredging (PDF) (pp 2,150 - 2,769 of 2,960 pp, 107 MB)
- Sediment Trap Study Summary Report, 2009 Remedial Dredging (PDF) (42 pp, 2.5 MB)
- Appendix A (PDF) (7 pp, 532 K)
- Appendix B (PDF) (16 pp, 2.2 MB)
- Appendix C (PDF) (470 pp, 5.9 MB)
- Appendix D (PDF) (46 pp, 1.4 MB)
- NBH Sediment Trap Report 2008 (PDF) (57 pp, 6.5 MB)
- Appendix A (PDF) (99 pp, 8.6 MB)
- Appendix B (PDF) (217 pp, 2.9 MB)
- Appendix C (PDF) (80 pp, 5.2 MB)
North of Wood Street Monitoring
Located at the far northern end of the upper harbor is the North of Wood Street study area. This area extends for about a quarter of a mile north of the Wood Street Bridge between New Bedford and Acushnet, Massachusetts. The intertidal zone, shoreline, in-river sediment and marsh soil in this area was prioritized early on for cleanup and restoration activities based on the high levels of PCB contamination and the close proximity to shoreline residential and recreational land use. During the winter of 2002-2003 about 15,000 cubic yards of material was removed from the area. See photos of the cleanup.
Sampling occurs on an annual, or as needed basis, as part of an environmental monitoring program to assess any potential recontamination from tidal sediment transport from areas in the harbor that are undergoing or awaiting cleanup. Twenty-one locations have historically been sampled: 12 sediment stations in the river, 6 soil locations in the marsh area that was cleaned up on the east side south of River View Park, and 3 shoreline stations on the west side of the river. These stations were last sampled in April of 2010.
- April 2012 "North of Wood Street Post-Remediation Monitoring" report (PDF) (560 pp, 14.1 MB)
- April 2011 "North of Wood Street Post-Remediation Monitoring" report (PDF) (pp 2,770 - 2,960 of 2,960 pp, 107 MB)
- April 2010 "North of Wood Street Post-Remediation Monitoring" report (PDF) (211 pp, 9.2 MB)
- North of Wood St. Monitoring Summary Report - 2007 Remedial Dredging (PDF) (25 pp, 6.8 MB)
- Appendix A (PDF) (30 pp, 11.1 MB)
- Appendix B (PDF) (9 pp, 26 K)
- North of Wood St. Monitoring Summary Report - 2006 Remedial Dredging (PDF) (60 pp, 1.9 MB)
Sawyer Street Groundwater Monitoring
In addition to serving as the location of site project offices, the Sawyer Street facility houses the sediment de-sanding operation, a preliminary step in the process of PCB removal in the sediment and is the support area for the harbor cleanup. The area serves as an active PCB material stockpiling, storage, trucking and processing zone. More information about the use of this site is available in EPA's March 2010 Explanation of Significant Differences document (PDF) (16 pp, 1 MB).
There are six groundwater wells located at the perimeter of site to evaluate the integrity of storage areas and confirm that the stored contamination is not migrating or posing a risk to human health and environment. The groundwater monitoring as well as ambient air monitoring for PCBs and VOCs provide additional assurance that the facility is functioning as expected. Stormwater runoff is also stored in an additional holding cell and is tested and treated if necessary prior to being discharged into the harbor. No releases of contaminants from the area that exceed established risk levels have been documented to date, see below for monitoring results. The final remedy for addressing the stored contamination will be addressed in a future Superfund decision document.
- 2014 Biannual Groundwater Monitoring, Sawyer Street Pilot Study Confined Disposal Facility
- 2012 Biannual Groundwater Monitoring, Sawyer Street Pilot Study Confined Disposal Facility (PDF) (331 pp, 9.5 MB)
- 2011 Biannual Groundwater Monitoring, Sawyer Street Pilot Study Confined Disposal Facility (PDF) (872 pp, 7.6 MB)
- 2010 Biannual Groundwater Monitoring, Sawyer Street Pilot Study Confined Disposal Facility (PDF) (pp 1,810 - 2,149 of 2,960 pp, 107 MB)
- 2009 Biannual Groundwater Monitoring, Sawyer Street Confined Disposal Facility (PDF) (224 pp, 3 MB)
- Sawyer Street 2008 Semi-annual Groundwater Monitoring Technical Memorandum (PDF) (10 pp, 1.2 MB)
- Appendix A (PDF) (25 pp, 3.1 MB)
- Appendix B (PDF) (243 pp, 4.3 MB)
- Sawyer Street Semi-annual Groundwater Monitoring Technical Memorandum (PDF) (7 pp, 1.7 MB)
- Appendix A (PDF) (20 pp, 2.7 MB)
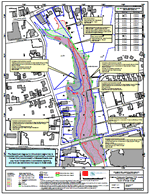
Sediment Dredging Progress Monitoring
View a larger version of image.
Sediment samples are collected before, during and after each cleanup season as one of the fundamental ways to track the progress and final results of the dredging operations. Environmental scientists study the sediment samples to identify the concentration of PCBs or other contaminants in the sediment. These samples provide vital information for EPA to determine extent of cleanup success and develop the dredge plan for the upcoming year.
- Sediment Monitoring Summary Report, 2012 Remedial Dredging (PDF) (1,067 pp, 41.9 MB)
- Sediment Monitoring Summary Report, 2011 Remedial Dredging (PDF) (1,159 pp, 15.8 MB)
- Sediment Monitoring Summary Report, 2010 Remedial Dredging (PDF) (pp 415 - 1,809 of 2,960 pp, 107 MB)
- Sediment Monitoring Summary Report, 2009 Remedial Dredging (PDF) (58 pp, 3.5 MB)
- Appendix A (PDF) (281 pp, 37.4 MB)
- Appendix B (PDF) (682 pp, 4.5 MB)
- Appendix C (PDF) (30 pp, 1.9 MB)
- Sediment Monitoring Summary Report, 2008 Remedial Dredging (PDF) (41 pp, 2.8 MB)
- Appendix A (PDF) (125 pp, 13.1 MB)
- Appendix B (PDF) (110 pp, 2.9 MB)
- Sediment Monitoring Summary Report - 2007 Remedial Dredging (PDF) (54 pp, 7.4 MB)
- Appendices A- D (PDF) (331 pp, 23.8 MB)
- Sediment Sampling Summary Report - 2004-2005 Marsh Island, August 2006 (PDF) (54 pp, 32.9 MB)
- Sediment Monitoring Summary Report - 2006 Remedial Dredging (PDF) (464 pp, 17 MB)
See below for early sediment sampling information.
2012 Near-Shore Boring Program Adjacent to the Former Aerovox Facility
The former Aerovox facility was the primary source of PCBs discharged to the Acushnet River and New Bedford Harbor. In 2012, twelve sediment/soil borings were advanced to bedrock in the near-shore area adjacent to the former Aerovox facility to obtain a vertical profile of remaining PCBs and select solvents in and under the marine sediment. The 2012 boring program provided an updated examination of the near-shore sediment contamination in New Bedford Harbor, abutting the Aerovox Site. The results of this boring program will be used in the design and scheduling of further dredging along the shoreline as part of the overall remediation of the New Bedford Harbor Superfund Site.
- Final Technical Memorandum, Summary of Findings, New Bedford Harbor Superfund Site, 2012 Near-Shore Boring Program Adjacent to the Former Aerovox Property, April 2013 (PDF) (63 pp, 4.5 MB)
- Final Report, Sediment Boring Collection and Analysis Off the Former Aerovox Site Property Shoreline, New Bedford Harbor Superfund Site, April 2013 (PDF) (72 pp, 1.8 MB)
Annual Dredging Reports
Annual dredge reports are generated by the project team to provide documentation of the key activities performed and the progress achieved at the New Bedford Harbor site. These reports, sometimes called After Action Reports, are generated after a dredging cycle has been completed. Below are the reports from harbor dredge seasons since 2004 as well as reports from the hot spot dredging in 1997, north of Wood Street dredging in 2002 and north lobe dredging in 2005.
- 2013 Dredge Season Data Submittal New Bedford Harbor Remedial Action, December 2014
- 2012 Dredge Season Data Submittal New Bedford Harbor Remedial Action, May 2013
- 2011 Dredge Season Data Submittal New Bedford Harbor Remedial Action, March 2013
- 2010 Dredge Season Data Submittal New Bedford Harbor Remedial Action, March 2011 (PDF) (498 pp, 141 MB)
- 2009 Dredge Season Data Submittal New Bedford Harbor Remedial Action, April 2010 (PDF) (163 pp, 1.8 MB)
- 2008 Dredge Season Data Submittal New Bedford Harbor Remedial Action, May 2009 (PDF) (184 pp, 17.9 MB)
- 2007 Dredge Season Data Submittal New Bedford Harbor Remedial Action, January 2008 (PDF) (117 pp, 696 K)
- 2006 Dredge Season Data Submittal New Bedford Harbor Remedial Action, January 2007 (PDF) (143 pp, 1.7 MB)
- 2005 After Action Report New Bedford Harbor Remedial Action, August 2006 (PDF) (242 pp, 2.1 MB)
- North Lobe Dredging After Action Report New Bedford Harbor, May 2005
- Report (PDF) (48 pp, 5.3 MB)
- Appendices (PDF) (251 pp, 12.3 MB)
- Response to Comments (PDF) (10 pp, 81 K)
- Transmittal of Shop Drawings, Equipment Data, Material Samples, or Manufacturer's Certificates of Compliance (PDF) (1 pg, 30 K)
- Final 2004 After Action Report New Bedford Harbor Superfund Site, November 2005 (PDF) (241 pp, 2.2 MB)
- 2002 After Action Report for North of Wood Street Remediation, New Bedford Harbor Superfund Site, Operable Unit #1, New Bedford, Massachusetts, April 2005 (PDF) (285 pp, 27 MB)
- Final Pre-Design Field Test Dredge Technology Evaluation Report, August 2001 (PDF) (119 pp, 3.7 MB)
- Report on the Effects of the Hot Spot Dredging Operations, October 1997 (PDF) (26 pp, 1.7 MB)
State Enhanced Remedy
The State Enhanced Remedy (SER) consists of navigational dredging and disposal activities within the New Bedford Harbor Superfund Site. Consistent with CERCLA and its implementing regulations, the Commonwealth of Massachusetts requested that EPA include the SER work in the remedy for the Upper and Lower Harbor (Operable Unit 1). After public review and comment, EPA integrated the SER into the 1998 Record of Decision for the Upper and Lower Harbor. Among other things, the SER benefits the remedy because navigational dredging removes sediment in the lower harbor contaminated with PCB concentrations up to 50 ppm and heavy metals that are below EPA's cleanup levels and that would not be otherwise addressed. SER work began in 2004.
- Status Update - TSCA Determination and PCB Concentrations Navigational CAD Cells Constructed Under the State Enhanced Remedy, June 1, 2015 (PDF) (7 pp, 638 K)
- First Amendment to the Memorandum of Agreement Between MA DEP and US EPA Region 1, January 8, 2015 (PDF) (10 pp, 1.1 MB)
- Administrative Record Index for the Third Modification to EPA's Final Determination for the South Terminal Project – Channel Widening and Additional Blasting, December 2014 (PDF) (31 pp, 944 K)
- Final Modified TSCA Determination, December 5, 2014 (PDF) (15 pp, 2.9 MB)
- Third Modification to EPA's Final Determination for the South Terminal Project, September 30, 2014 (PDF) (111 pp, 45.2 MB)
- Administrative Record for the Second Modification to EPA's Final Determination for the South Terminal Project 09/30/2013
- Second Modification to EPA's Final Determination for the South Terminal Project (PDF) (119 pp, 21.4 MB)
- Administrative Record Index for the Final Determination For The Proposed South Terminal Project - State Enhancement Remedy (SER), November 19, 2012 (PDF) (380 pp, 1.2 MB)
- Modification to Appendix E of the Final Determination for the South Terminal Project, February 4, 2013 (PDF) (1 pg, 450 K)
- EPA's Final Determination for the South Terminal Project, November 19, 2012 (PDF) (469 pp, 59.7 MB)
- Administrative Record Index, Determination For The Proposed South Terminal Project - State Enhancement Remedy (SER), July 23, 2012 (PDF) (224 pp, 4.5 MB)
Additional Long Term Monitoring Activities
View a larger version of image.
In order to assess the effectiveness of the New Bedford Harbor Superfund cleanup efforts, a long-term environmental monitoring program has been in place since 1993. This is an intensive sampling and analysis effort conducted to quantify the environmental effects of reduced PCB levels in the sediment and water column of the New Bedford Harbor estuary as a result of the cleanup efforts. To date, five sampling events of this kind have taken place to monitor the physical, chemical and biological changes in the harbor. The initial, or baseline, round of sampling occurred in October 1993 (reported in Baseline Sampling, October 1996) and represents conditions prior to cleanup work. A second event was conducted immediately following the removal of "hot spot" sediment in 1995 (results were not compiled into a separate report but information about the results may be found in the 1998 ROD for this site, specifically pages 14 and 15 and Figures 18 - 20c) and a third event in 1999 (reported in Survey III: Summary Report, March 2001). The most recent sampling efforts occurred in 2004 (reported in Survey IV: Summary Report, December 2005) when limited dredging had occurred and in 2009 (reported in Survey V: Summary Report, November 2010), five years after the start of the full-scale dredging process that is currently being used to address the contamination in the upper harbor.
The sampling effort includes multiple stations within the designated project areas:
- Area 1 (upper harbor) - Wood Street to the Coggeshall Street Bridge (27 stations)
- Area 2 (lower harbor) - Coggeshall Street Bridge to Hurricane Barrier (29 stations)
- Area 3 (outer harbor) - Hurricane Barrier to edge of Fishing Closure Area 3
See the latest seafood guidance (23 stations)
In addition to the monitoring reports shown below, for an illustrated summary highlighting the results of the program, see the April 29, 2010 presentation (PDF) (22 pp, 24.3 MB).
Long Term Harbor Monitoring Program
- Long Term Monitoring Program: Comparative Analysis of the 2014 LTM Collection, September 23, 2015
- 2014 Long Term Monitoring Survey VI: Final Summary Report, September 2015
- Long Term Monitoring Survey V: Summary Report, November 2010 (PDF) (1,663 pp, 40.4 MB)
- Long Term Monitoring Survey IV: Summary Report, December 2005 (PDF) (201 pp, 95.7 MB)
- Long Term Monitoring Survey III: Summary Report, March 2001 (PDF) (140 pp, 8.4 MB)
- Long-Term Monitoring Assessment Report: Baseline Sampling, October 1996 (PDF) (44 pp, 2.7 MB)
Outer Harbor Study
Starting in late 2009, EPA initiated a Remedial Investigation/Feasibility Study (RI/FS) of approximately 17,000 acres located south of the hurricane barrier, known as the outer harbor. The RI/FS includes field sampling activities to determine the nature and extent of contamination, a risk assessment, a review of technologies and range of response actions to address any risk found. Completion of the RI/FS for the outer harbor is currently estimated for the year 2012. EPA will continue to keep the public informed about the progress of the outer harbor study at the monthly public meetings.
Pilot Underwater Cap Monitoring
- Final Technical Memorandum: Operable Unit #3 Pilot Cap Sediment Monitoring, May 2013
- U.S. Coast Guard Designates the Underwater Pilot Cap Area as a Restricted Navigation Area on June 20, 2011
- Final 2011 Bathymetric Survey of Pilot Underwater Cap (PDF) (72 pp, 2.1 MB)
- 2010 PCB Monitoring of the Pilot Underwater Cap (PDF) (5 pp, 289 K)
- Final 2010 Bathymetric Survey of Pilot Underwater Cap, February 2011 (PDF) (51 pp, 326 K)
- Final 2009 Bathymetric Survey of Pilot Underwater Cap, March 2010 (PDF) (20 pp, 1.2 MB)
- 2007 Bathymetric Survey (PDF) (15 pp, 1.6 MB)
- Operable Unit 3 Pilot Underwater Cap: Post-Cap Monitoring Update (PDF) (7 pp, 921 K)
- Cap Thickness at Completion of Pilot, July 26, 2005 (PDF) (1 pg, 1 MB)
- Presentation Given at the May 19, 2005 Public Meeting (PDF) (25 pp, 3.2 MB)
- Harbor Cleanup News, Harbor PCB Cleanup Accelerated South of Hurricane Barrier, May 2005 (PDF) (8 pp, 250 K) (this incorporates the portuguese version of the same fact sheet)
Earlier Cleanup Actions
The EPA's original 1990 remedy for the hot spot area included dredging and on-site incineration of those PCB-contaminated sediments above 4,000 ppm. Due to a vehement and congressionally-supported reversal of local support for incineration, EPA elected to postpone the incineration component of the hot spot remedy and explore alternative treatment approaches. Dredging of the 14,000 cubic yards of sediment from the 5 acre hot spot areas was accomplished from April 1994 to September 1995, with the dredged sediment temporarily stored in a lined and covered holding pond. Seawater removed from the sediments during dredging was treated on site. Pilot studies of solidification and chemical destruction technologies were completed in the fall of 1996, and a feasibility study of alternative remedial approaches was issued in December 1997. EPA issued an Amended Record of Decision (ROD) in April 1999 which included dewatering and off-site landfill disposal as the final component for the hot spot remediation. Transportation of the hot spot sediment to an offsite TSCA permitted landfill started in December 1999 and was completed in May 2000.
Other Earlier Cleanup Projects & Maps
- Acushnet Shoreline, North of Wood Street, North Lobe, Packer Pier
- Areas Remediated through 2008 (PDF) (1 pg, 3.9 MB)
- Areas Remediated through 2007 (PDF) (1 pg, 1.4 MB)
Early Sediment Sampling Work "Sediment Characterization"
- Inferred PCB Levels - 0 to 12 Inch Depth, May 2001 (PDF) (1 pg, 1.1 MB)
- Characterization Sediment Sample Locations Prior to Remediation (for samples collected before May 2003)
- Sheet 1 of 10, October 21, 2003 (PDF) (1 pg, 441 K)
- Sheet 2 of 10, October 21, 2003 (PDF) (1 pg, 437 K)
- Sheet 3 of 10, October 21, 2003 (PDF) (1 pg, 431 K)
- Sheet 4 of 10, October 21, 2003 (PDF) (1 pg, 434 K)
- Sheet 5 of 10, October 21, 2003 (PDF) (1 pg, 338 K)
- Sheet 6 of 10, October 21, 2003 (PDF) (1 pg, 565 K)
- Sheet 7 of 10, October 21, 2003 (PDF) (1 pg, 210 K)
- Sheet 8 of 10, October 21, 2003 (PDF) (1 pg, 228 K)
- Sheet 9 of 10, October 21, 2003 (PDF) (1 pg, 98 K)
- Sheet 10 of 10, October 21, 2003 (PDF) (1 pg, 175 K)
- Sediment Data Collected Through April 2003 - Total PCBs (MG/KG) (PDF) (1 pg, 471 K)
- 2008 Wetland Sediment Core Locations Update, September 29, 2008
- Index Map (PDF) (1 pg, 675 K)
- Figure 2 (PDF) (1 pg, 229 K)
- Figure 3 (PDF) (1 pg, 407 K)
- Figure 4 (PDF) (1 pg, 329 K)
- Figure 5 (PDF) (1 pg, 368 K)
- Figure 6 (PDF) (1 pg, 376 K)
- Figure 7 (PDF) (1 pg, 294 K)
- Figure 8 (PDF) (1 pg, 417 K)
- Figure 9 (PDF) (1 pg, 296 K)
- Figure 10 (PDF) (1 pg, 299 K)
New Bedford Harbor Five Year Reviews
- Third Five Year Review Report, September 30, 2015
- Second Five-year Review, September 30, 2010 (PDF) (144 pp, 3.9 MB)
- Five-year Review, September 30, 2005 (PDF) (46 pp, 9 MB)
Other Relevant Documents
Feasibility Studies/Modeling Studies/Risk Assessments
- Focused Feasibility Evaluation (FFE): Comparison of Confined Disposal Facilities (CDFs) A, B & C versus Off-Site Disposal of PCB Contaminated Sediment, April 2015
- Assessment of Contaminant Loss and Sizing for Proposed Upper Harbor Confined Aquatic Disposal (CAD) Cell (PDF) (111 pp, 5.5 MB)
- Draft Final Supplemental Feasibility Study Evaluation for Upper Buzzards Bay New Bedford Harbor RI/FS New Bedford, Massachusetts, May, 1992, Prepared by EBASCO Services, Inc. for EPA (PDF) (173 pp, 25.8 MB)
- Overview of the New Bedford Harbor Physical/Chemical Modeling Program, April 1, 1991 (PDF) (30 pp, 1.4 MB)
- Baseline Ecological Risk Assessment, April 1990 (PDF) (62 pp, 2.9 MB)
- 1990 Site Modeling
- Final Report for Modeling of Transport, Distribution, and Fate of PCBS and Heavy Metals in Acushnet River/Buzzards Bay System, September 21, 1990
- Vol. 1 of 3 (PDF) (145 pp, 7.6 MB)
- Vol. 2 of 3 (PDF) (257 pp, 11.4 MB)
- Vol. 3 of 3 (PDF) (157 pp, 8.9 MB)
- Appendix Vol. 1, Appendices A-D (PDF) (226 pp, 6.2 MB)
- Appendix Vol. 2, Appendices E-F (PDF) (251 pp, 7.9 MB)
- Appendix Vol. 3, Appendices G-M (PDF) (189 pp, 6.5 MB)
- Final Report for Modeling of Transport, Distribution, and Fate of PCBS and Heavy Metals in Acushnet River/Buzzards Bay System, September 21, 1990
- Natural Resource Damage ROD and the Final Environmental Assessment (Round II) (PDF) (137 pp, 1.3 MB)
- Final NPL Listing (PDF) (42 pp, 475 K)
- NPL Site Narrative at Listing (PDF)(1 pg, 13 K)