Contact Superfund, Pacific Southwest
Pacific Southwest, Region 9
Serving: Arizona, California, Hawaii, Nevada, Pacific Islands, Tribal Nations
Palos Verdes Shelf
Pilot Capping Project: Summary of Activities
Objectives
Map showing three pilot capping sites (red rectangles) close to Los Angeles County Sanitation District sewer outfalls
The Palos Verdes Shelf Pilot Capping Project will evaluate the short-term results of capping the DDT-contaminated sediment with clean sediment. It will also determine how these results are affected by variables such as cap material, placement method and water depth. The results from the pilot project, along with other relevant information, will be used by the EPA in deciding whether or not to propose full-scale capping as a cleanup action for the site.
Specific objectives to be addressed in the pilot project include:
- Evaluating cap construction methodologies using two different cap materials
- Evaluating related short-term impacts on the marine environment
- Determining the effects of cap material, bottom slope, water depth, and placement method (e.g., conventional versus spreading) on displacement and/or resuspension of the contaminated sediment.
- Demonstrating the ability to monitor operations and assess cap placement impacts.
Cap Placement
The following table summarizes capping activity that was conducted as part of the pilot project:
Area of Pilot Capping
Three capping cells with a total area of 135 acres (45
acres/cell), northwest of the Los Angeles
County Sanitation District outfall system
Capping Scenarios
| Cell | Water Depth | Cap Material | Placement Method | Projected Cap Thickness/Area | No. of Loads | Approx. Total Volume (cy) |
| LU | Shallow (150 ft) | Queens Gate | Conventional | 15 - 45 cm (6 - 18") over entire cell | 71 | 91,315 |
| LD | Shallow (150 ft) | Borrow Site | Spreading | < 10 cm in center lane only | 9 | 13,505 |
| Shallow (150 ft) | Queens Gate | Pumpout thru drag arm | n/a (1 load only) | 1 | 390 | |
| SU | Deep (200 ft) |
Queens Gate | Conventional | 15 cm in center portion of cell | 21 | 29,835 |
Totals |
102 |
135,045 |
Schedule
The first load of capping material was placed on August 2, 2000 and
all cap placement activity was completed by September 14, 2000. The
field work for the baseline monitoring in the pilot capping cells was
started in mid-May, and the final post-cap monitoring activity was completed
September 15th, a few days after the last load was placed in cell LU.
A final report is expected in Novermber, 2001.
Monitoring
The environmental monitoring program collected data before, during and
after cap placement to address key questions about the feasibility of
capping on the Palos Verdes Shelf. The EPA used a variety of approaches
and technologies to monitor and to assess the impacts of cap construction,
including:
- sediment profile images (photos) that show cap thickness, disruption of the existing contaminated sediment, and the presence of sediment-dwelling organisms (e.g., worms and other burrowers) before and after capping;
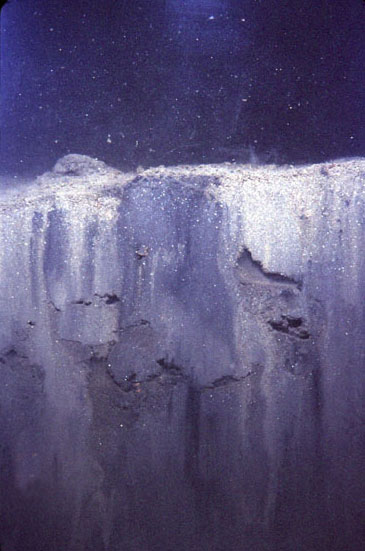
Sediment prior to pilot cap construction. Portions of the burrows created by sediment-dwelling organisms are visible.
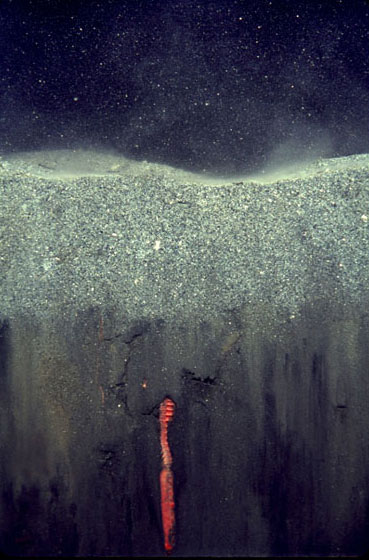
Sediment partway through pilot project. Clean gray cap sediment from the Queen's Gate channel covers original sediment. Cap thickness shown is about 1 1/2 inches. A worm that lives in the sediment is visible.
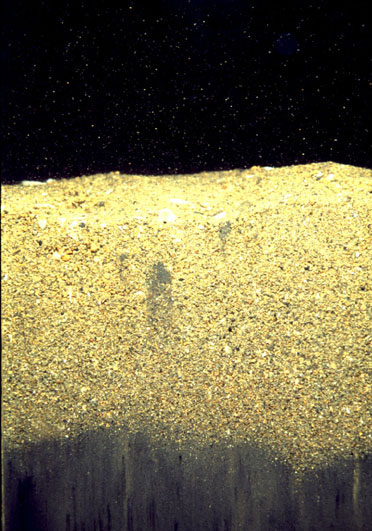
Sediment partway through pilot project. Clean yellow sand cap sediment from a borrow site outside of the LA/Long Beach harbor breakwater covers original sediment. Cap thickness shown is about 2 1/2 inches.
- sediment cores that provide data on cap thickness, the degree to which contaminated sediments mix with clean cap material, and the stability of the cap after construction;
- water samples and water column measurements to determine whether contaminated sediment gets resuspended during cap construction (and if so, how far it travels before settling to the bottom again) and to assess the turbidity plume created by cap placement;
- current meters and optical back scatter meters that help define both the lateral extent of the surge created when the descending cap material reaches the bottom and the speed and direction of the current at different water depths (which affect the spread of cap material);
- side-scan sonar and sub-bottom acoustic profiling to assess the area and thickness of the cap;
- sediment samples from the hopper dredge to use in modeling cap placement and to assess placement methods;
- dredge position and load curves to document where each load of cap material comes from and where it is placed.
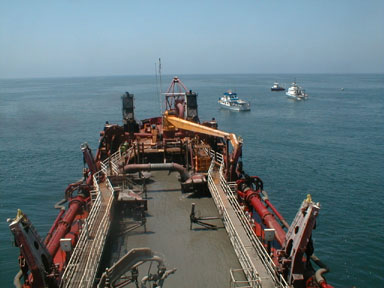
The hopper dredge "Sugar Island" approaches the first dumping location in early August. These three boats used underwater equipment to monitor placement of the first capping load.
The monitoring program during cap placement involved 59 trips by survey vessels, with as many as three survey vessels on site at any one time.