TRI.NET Tutorial with Examples
This tutorial shows how the TRI.NET tool can be used to answer a series of related step-wise questions. The example is intended to highlight the different features of the TRI.NET tool and show how the tool can be used to answer real-world questions.
- Do you live near businesses that use toxic chemicals?
- Compare average releases for businesses in your area to averages for:
Do you live near businesses that use toxic chemicals?
1. Select your location/area

Start by clicking the "My TRI Neighborhood" button, which will open the My Neighborhood box. You can now enter a partial or complete address to be geocoded to the corresponding latitude/longitude coordinates on a map. In this example, a street name in Cleveland, Ohio is used. Note that without a specific address (i.e., street number), the Geocoder will assign the latitude and longitude associated with the midpoint of the street. Depending on how long the street is, this midpoint could be far from the location you intended.
Enter the following address and enter a distance of 5 miles, then click "Go."
Address: Lorain Ave Cleveland, Ohio
Show Facilities within 5 miles

Notice that after you click "Go," the latitude and longitude coordinates associated with the address are presented in the lower left corner of the My Neighborhood box. Click "OK" to accept the coordinates associated with your address. After clicking "OK" you will notice that the background of the My TRI Neighborhood button is filled, indicating that it is activated, and that any subsequent queries will be filtered to return only those facilities that fall within the specified distance from your address. To de-activate the My TRI Neighborhood filter, click the "My TRI Neighborhood" button and then click "Cancel." The My TRI Neighborhood button should no longer be highlighted.

2. Get a count of businesses in your area
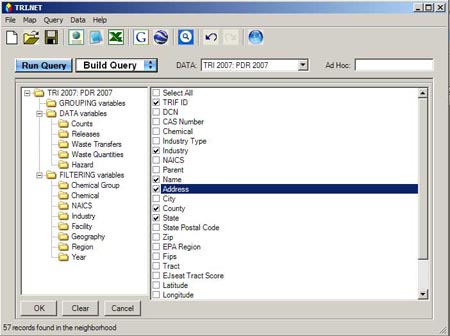
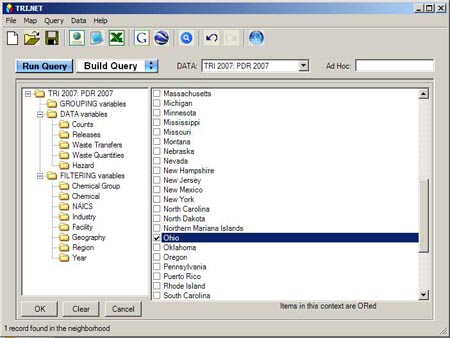
Next, click the "Build Query" menu to open the Build Query screen.
![]()
Start by clicking GROUPING variables and select County and State.
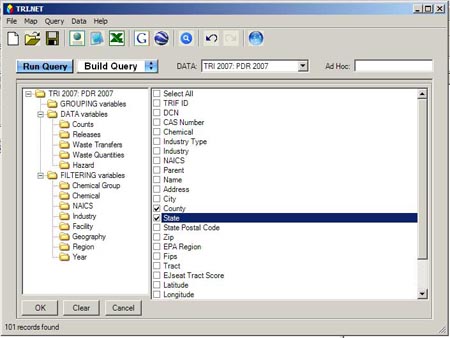
Next, click on the Counts folder under DATA variables and click Facility count, Form R count, and Form A count.

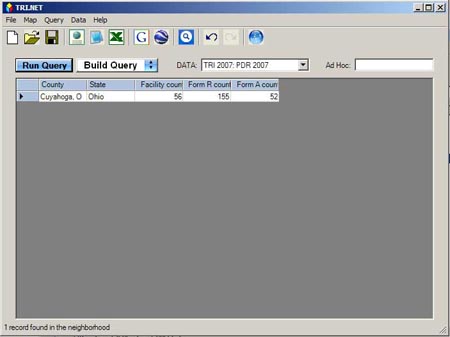
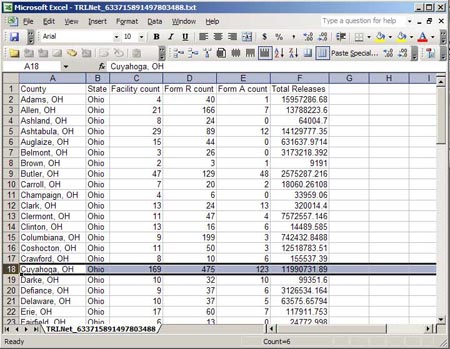
Now, click the "Run Query" ![]() to generate a count of facilities and submission counts for the facilities located within 5 miles of Lorain Avenue, Cleveland, Ohio. Save these results by clicking the "Send to Excel" button
to generate a count of facilities and submission counts for the facilities located within 5 miles of Lorain Avenue, Cleveland, Ohio. Save these results by clicking the "Send to Excel" button ![]() . You can also use the" Save File As"
. You can also use the" Save File As" ![]() or "Send to Notepad"
or "Send to Notepad" ![]() options. In this example the data are sent to Excel.
options. In this example the data are sent to Excel.
3. Get names, addresses, and industry sector of businesses in your area
The easiest way to see more detail in your report is to use the Drill Down feature. This feature allows you to add additional selections to the GROUPING variables directly from the output report without having to re-open the Build Query menu and re-run the Query.
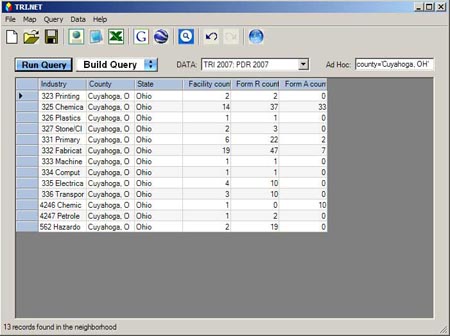
Access the Drill Down options by right-clicking on a cell in the output report. Note that the Drill Down variables available are relative to the cell you click on (i.e., only those GROUPING variables upon which the current selection can be further subdivided). In the current example, if you put the cursor on the cell containing "CUYAHOGA," click the right mouse button, and then move the cursor over the Drill Down option, you will see a list of 6 Drill Down options.

Selecting Industry from the Drill Down, for example, will produce facility and submission counts by TRI Industry for Cuyahoga County.
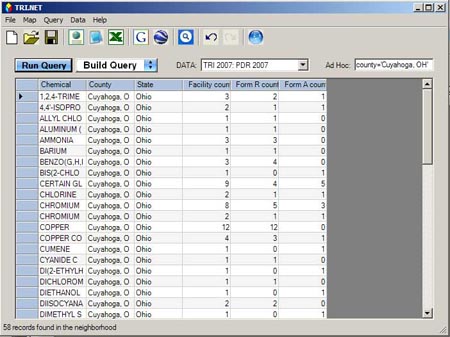
Similar Drill Down options are available for Chemical, DCN, TRIFID, City, and Zip.
Using the Drill Down function will automatically revise the Build Query options to reflect the new GROUPING variable selected. The Drill Down option function may also update the Ad Hoc window (see Section 6b of User's Guide for instructions on using Ad Hoc).
The other option for refining your results is to directly modify the existing Build Query selections. Assume that the Drill Down function described above was not carried out and that the original selections previously made (State, County) are still active. [NOTE: If the Drill Down function was used you can use the Undo button to go back.] You could click the "Build Query" button to re-open the Build Query screen and then select the additional GROUPING variables for which you want a report. For example, select TRIFID, Industry, Name, and Address.
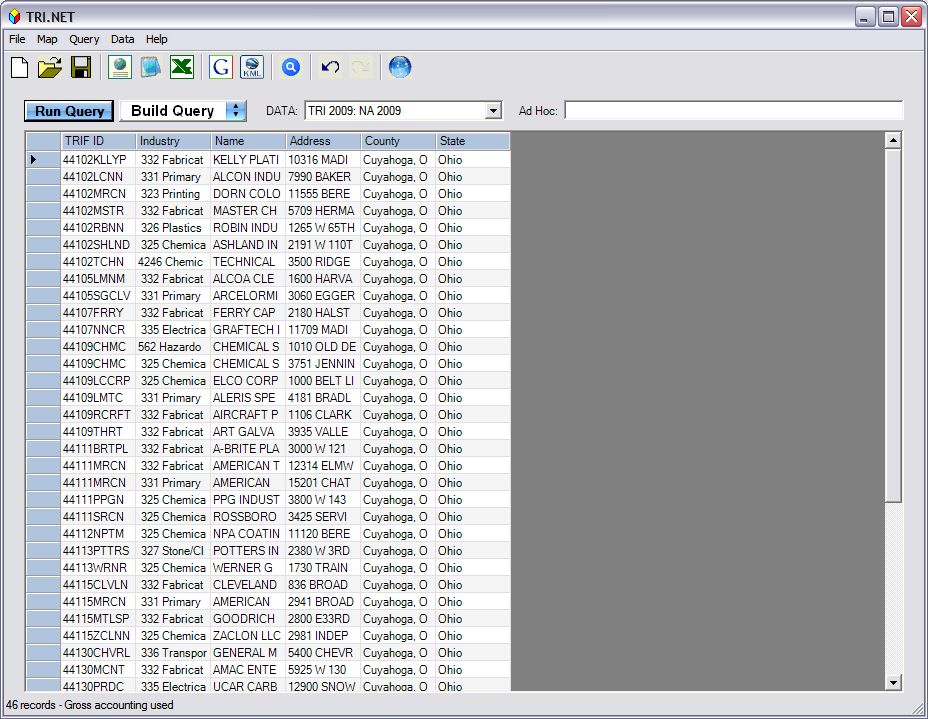
Now, click the "Run Query" button to see the name, address, and 3-digit North American Industry Code for each of the 61 facilities located within 5 miles of Lorain Avenue, Cleveland, Ohio.

There are a number of options for re-formatting the results table that closely mimic those available for spreadsheet tables such as Microsoft Office Excel. For example, if you move the cursor to the vertical dividing line between two columns, a horizontal arrow will appear. When this arrow is showing you can click and hold the left button on your mouse and then drag the mouse to expand or shrink the column width. You can also put the cursor on the dividing line between two columns, and double-click the left button on the mouse to automatically re-size a column to the optimal width.
You can save this facility list by clicking "Send to Notepad," or "Send to Excel."
4. Map those businesses
In order to use the Map Selection in Google Maps or Google Earth functions, you must have included the TRIFID in your table, and you must select the facilities you want to be mapped. Individual facilities can be selected by clicking on the blue box to the left of the row. The options for selecting rows in the results table closely mimic those available for typical spreadsheet tables such as Microsoft Office Excel. See Section 4g of the User's Guide for instructions for selecting rows.
To select all rows in the table click the blue box in the top left corner of the table or choose Select All from the Map menu.
After selecting the rows/facilities that you want to map, click the "Map Selection in Google Maps" button ![]() . This will launch a new window with a map of the facilities you selected.
. This will launch a new window with a map of the facilities you selected.
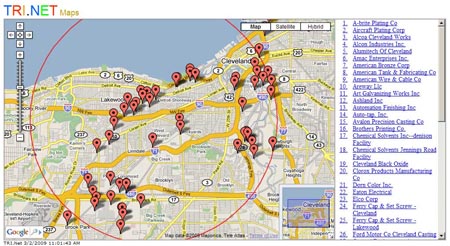
To the right of the map is a list of all the facilities in the map. Clicking on a facility name will highlight the location of that facility on the map. You can also click on any of the balloon icons on the map to see the name and address of that facility.
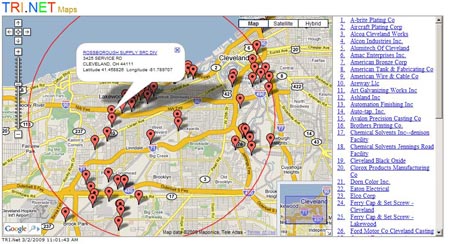
Note that the facility name in the pop-up box contains a hyperlink to an Envirofacts Report for that TRI facility.
5. Generate additional EPA reports for those businesses
TRI.NET contains several options for generating additional EPA reports for an individual TRI Facility. For example, if you return to the results table and right-click on any of the cells in the TRIFID column, you will see an EPA Report option. Move your cursor over the EPA Report option and then select the report you are interested in for that facility.
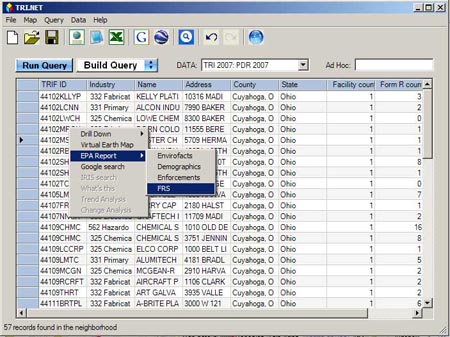
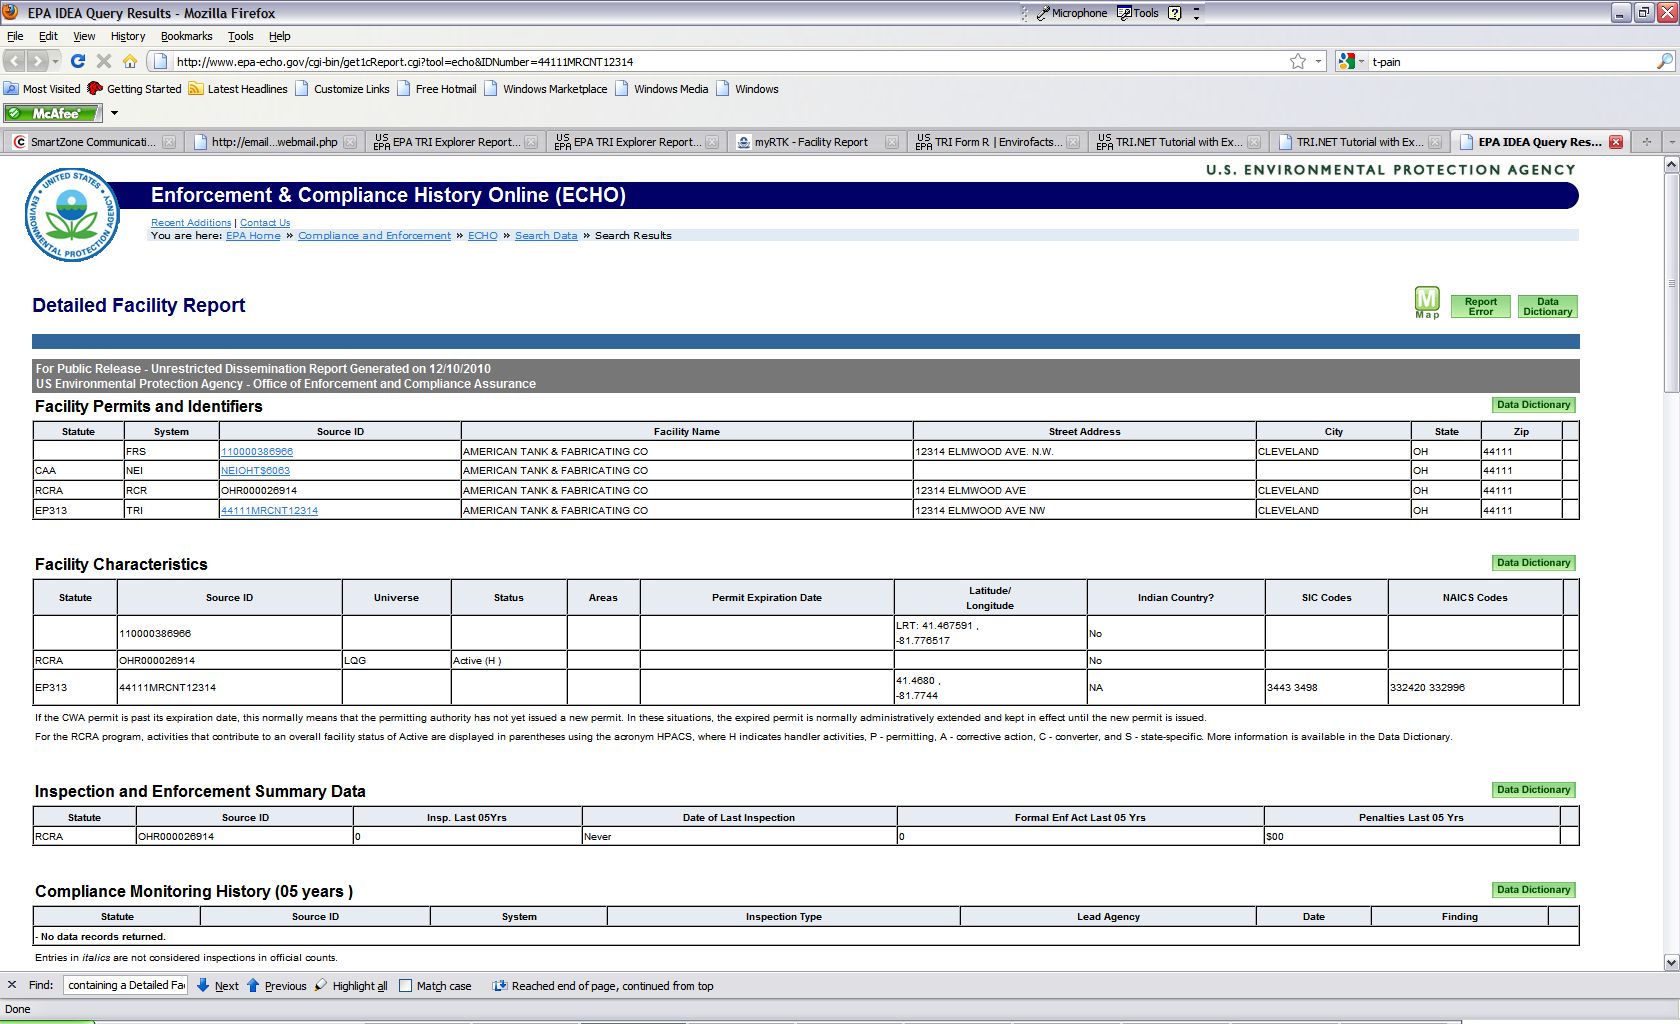
For example, clicking the "Enforcements" option will open a new window containing a Detailed Facility Report from EPA's Enforcement & Compliance History Online (ECHO). Other EPA reports available include Envirofacts, Demographics, and FRS.
Another useful feature available on the results page is the ability to perform a Google Search on the contents of any cell in your results. For example, if you want information on a particular industry code listed in your results, simply right-click the cell containing the industry code, and click "Google Search." A new window will open containing the results of a Google Search done on the contents of that cell.
Compare average releases for businesses in your area to averages for your county, the state, and the United States.
The following examples show how you can use TRI.NET to generate release estimates for TRI facilities in your neighborhood and then compare the average releases for those facilities with those of other TRI facilities in your county, state, and the entire United States.
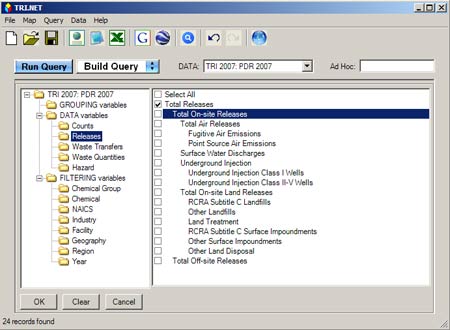
First, return to the Build Query screen and de-select everything from the GROUPING variables except County and State. Next, click the Releases folder and select Total Releases.
Click the "Run Query" button to generate the new report.
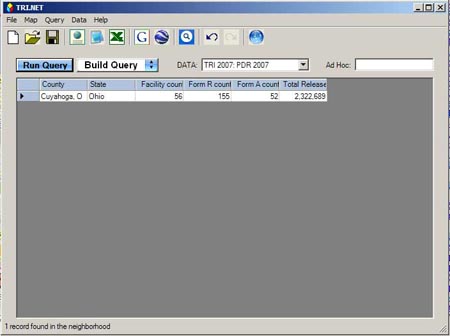
Click the "Send to Excel" button to save the results. This initial Excel file will be used to paste subsequent results for the county, State, and the United States.
1. Your County
Click the "My TRI Neighborhood" button and click "Cancel" to de-select the latitude and longitude filter. Subsequent reports will no longer be filtered by the 5-mile area surrounding Lorain Ave.
Next, open the Build Query window, click the "Geography" folder under FILTERING variables, and select Ohio.
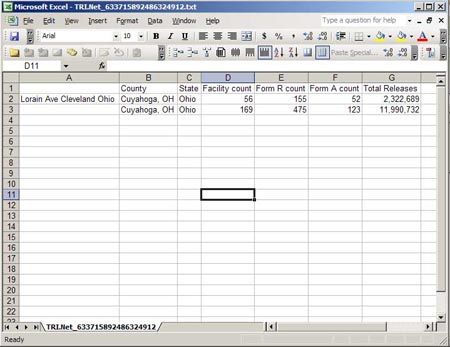
Click the "Run Query" button to generate the new report for all counties in Ohio and then click the "Send to Excel" button to save the results.
Since only Cuyahoga County is of interest, cut and paste the row for Cuyahoga from this Excel sheet to the spreadsheet containing results for the facilities in your neighborhood. You will need to re-format and edit the spreadsheet in order to line up and label the two different data rows.
2. Your State
One option for generating the same report for all of Ohio is to manually create a summary line in Excel that aggregates across all of the counties generated in the previous step. Another option is to go back to the Build Query screen and de-select County from the selected GROUPING variables. This will generate the same report as above for all of Ohio.
Assuming you edited the GROUPING variables, click the "Run Query" button to generate the new report for Ohio and then click the "Send to Excel" button to save the results. Cut and paste the row for Ohio to the original sheet, lining up the columns accordingly.

3. The United States
To generate the same report for the entire United States, go back to the Build Query screen and de-select State from the GROUPING variables. Since the query needs at least one GROUPING variable to be selected in order to run, select the Year variable. Next, de-select Ohio from the Geography FILTERING variables.
Click the "Run Query" button to generate a report for the entire United States and then click the "Send to Excel" button to save the results. Cut and paste the row for the U.S. to the original sheet, lining up the columns and labeling the rows accordingly. With a little formatting, your working spreadsheet should now look something like this.
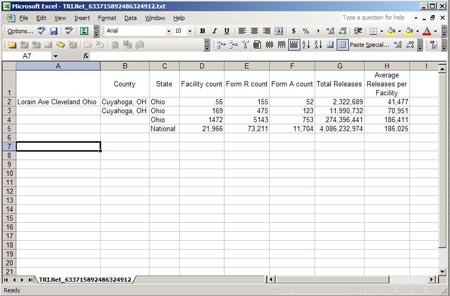
With this data, you can easily compute and compare the average Total Releases per facility at the local, county, state, and national level.