EasyRSEI Online Help - Rankings
EasyRSEI Rankings show how impacts from releases from the Toxics Release Inventory (TRI) compare to each other in any given year. Each ranking shows the annual totals for TRI-reported pounds and the six results produced by EPA's Risk-Screening Environmental Indicators (RSEI) model (RSEI Score, RSEI Hazard, etc.). Learn about RSEI.
The following RSEI Rankings are available from the main EasyRSEI page:
- Facility Rankings: Shows TRI Facility ID and facility name for each facility.
- Chemical Rankings: Shows CAS number and chemical name for each chemical.
- Industry Rankings: Shows 3-digit NAICS code and NAICS description for each industry.
- State Rankings: Shows postal abbreviation for each state.
- EPA Region Rankings: Shows EPA region number for each region.
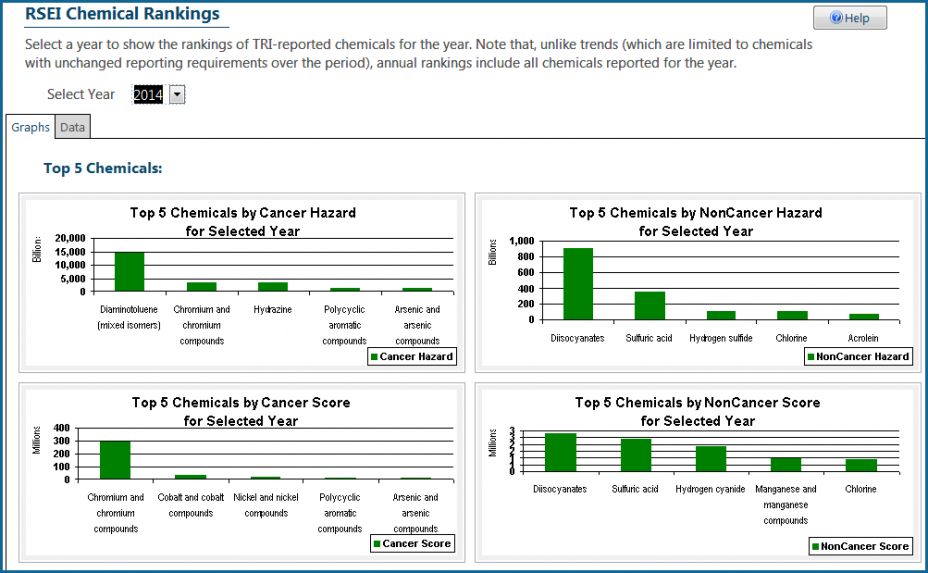
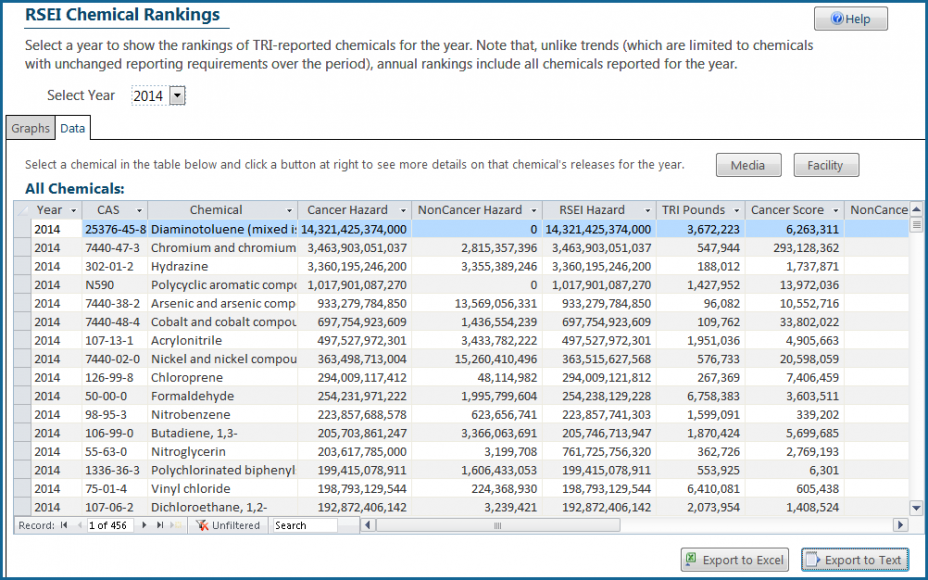
EasyRSEI rankings forms have graphs and data tables, as shown below. Click on the tabs at the top to switch between the graph and the data table.


EasyRSEI data tables have Microsoft Access functionality. You can click on the arrow to the right of any column header to sort by the column header. You can also use the options at the bottom of the table to filter the table results or search for a text string or number.
You can export the data shown on the screen by using the "Export" buttons.
Ranking data tables also have drill down buttons, as shown above at the top right. Select a row in the table and then click one of the buttons for more information. For example, in the table above, the user has selected 2014 and Diaminotoluene (mixed isomers) in the table. Clicking on the "Media" button would open a new form with a series of graphs showing the media breakdown of all Diaminotoluene releases in 2014 (that is, what percentage went to stack air, what percentage went to direct water, etc.) by different results (TRI Pounds, Cancer Hazard, NonCancer Hazard, Cancer Score, NonCancer Score).
For some drill down buttons, or drop-down menu selections, the refresh of the graphs and tables, or the opening of the new form may take a few seconds. This will depend on your computer. Look at the bottom right of your screen for a status bar. Click and hold the escape key to cancel the request.
