GHGRP 2013: Reported Data
All greenhouse gas data presented here reflect the information reported to EPA as of 08/18/2014. The reported emissions exclude biogenic CO2 unless otherwise noted and use the Global Warming Potentials from the IPCC’s Fourth Assessment Report. ![]()
For reporting year (RY) 2013, over 8,000 facilities and suppliers reported to the greenhouse gas reporting program (GHGRP). Among these reporters,
- 7,879 facilities in nine industry sectors reported direct emissions
- Reported direct emissions totaled 3.18 billion metric tons carbon dioxide equivalent (CO2e), about half of total U.S. greenhouse gas emissions.
- 965 suppliers reported
- 92 facilities reported injecting CO2 underground
Summary GHGRP data has been broken into several sections. Click the links below to expand each section.
- Greenhouse Gas Reporting Program Background
As directed by Congress, EPA’s Greenhouse Gas Reporting Program (GHGRP) collects annual greenhouse gas information from the top emitting sectors of the U.S. economy (Table 1). The GHGRP is the only dataset containing facility-level greenhouse gas (GHG) emissions data from large industrial sources across the United States. With four years of reporting for most sectors, GHGRP data are providing important new information on industrial emissions—showing variation in emissions across facilities within an industry, variation in industrial emissions across geographic areas, and changes in emissions over time at the sector and facility level. EPA is using this facility-level data to improve estimates of national greenhouse gas emissions, including using it to improve the U.S. Greenhouse Gas Inventory. The data are also being used to inform regulatory actions and voluntary emission reduction efforts.
This document summarizes national industrial sector emissions and trends.
Table 1: GHGRP Sector ClassificationsIndustry Sector Number of Reporters Emissions
(million metric tons CO2e)Power Plants 1,572 2,100.9 Petroleum and Natural Gas Systems 2,164 224.1 • Onshore Petroleum & Nat. Gas Prod. 503 94.8 • Offshore Petroleum & Nat. Gas Prod. 107 6.2 • Natural Gas Processing 433 59.0 • Natural Gas Trans./Compression 487 22.7 • Underground Natural Gas Storage 48 1.3 • Natural Gas Local Distribution Co. 173 15.1 • Liquefied Natural Gas Imp./Exp. Eq. 8 0.4 • Liquefied Natural Gas Storage 5 ** • Other Petroleum & Nat. Gas Systems 415 24.6 Refineries 145 176.7 Chemicals 473 174.6 Non-Fluorinated Chemicals • Adipic Acid Production 3 5.8 • Ammonia Manufacturing 23 25.1 • Hydrogen Production 109 41.9 • Nitric Acid Production 35 10.9 • Petrochemical Production 65 52.7 • Phosphoric Acid Production 12 1.8 • Silicon Carbide Production 1 0.1 • Titanium Dioxide Production 7 2.4 • Other Chemicals Production 226 20.6 Fluorinated Chemicals • Fluorinated GHG Production 16 9.4 • HCFC-22 Prod./HFC-23 Dest. 4 4.1 Waste 1,611 114.0 • Industrial Waste Landfills 174 8.6 • Municipal Landfills 1,220 93.0 • Solid Waste Combustion 68 10.0 • Industrial Wastewater Treatment 155 2.5 Metals 296 106.8 • Aluminum Production 11 6.8 • Ferroalloy Production 10 2.3 • Iron and Steel Production 126 84.2 • Lead Production 13 1.0 • Magnesium Production 9 1.4 • Zinc Production 6 0.9 • Other Metals Production 122 10.2 Minerals 376 111.3 • Cement Production 96 62.8 • Glass Production 109 8.2 • Lime Manufacturing 75 30.7 • Soda Ash Manufacturing 4 5.3 • Other Minerals 94 4.0 Pulp and Paper 233 39.1 • Pulp and Paper Manufacturing 110 27.3 • Other Paper Producers 123 11.8 Other 1,399 136.9 • Food Processing 322 30.8 • Ethanol Production 163 17.1 • Manufacturing 291 16.7 • Universities 112 9.2 • Military 43 2.5 • Other Combustion 170 11.1 • Underground Coal Mines 118 41.5 • Electronics Manufacturing 53 4.5 • Electrical Equipment Manufacturers 6 0.2 • Electrical Equipment Use 121 3.3 a The data presented here reflects data reported to the GHGRP as of 08/18/2014.
bBiogenic emissions are NOT included in the total emissions.
** Total reported emissions are less than 0.05 million metric tons CO2e.The GHGRP does not represent total U.S. GHG emissions, but provides facility level data for large sources of direct emissions, thus representing the majority of U.S. GHG emissions. The GHGRP data collected from direct emitters represent about half of all U.S. emissions. When including greenhouse gas information reported to the GHGRP by suppliers, emissions coverage reaches approximately 85–90% (See Figure 1). The Inventory of U.S. Greenhouse Gas Emissions and Sinks: 1990-2012 contains information on all GHG emissions sources and sinks in the United States.
Learn more about the differences between the Inventory and the GHGRP.
Figure 1: U.S. Greenhouse Gas Inventory and the Greenhouse Gas Reporting Program
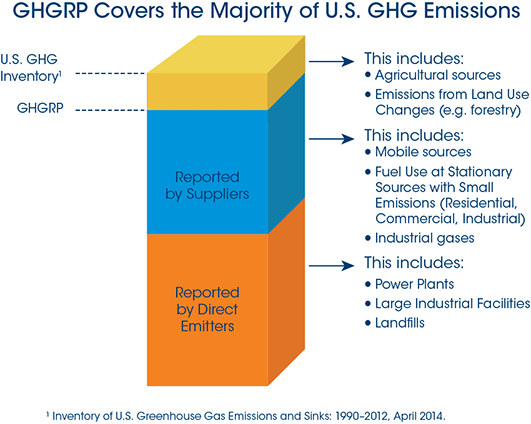
Suppliers report the quantity of GHGs that would be emitted if the fuels and industrial GHGs that they place into the economy each year are used/released. Reporting by suppliers helps account for the greenhouse gas emissions by the numerous low-emitting sources that are not required to report emissions under the GHGRP (e.g., mobile sources, residential sources). Learn more about suppliers and their 2013 reported data.
Table 2: Overview of GHG Data Reported (2013) Direct emitters Number of facilities reporting 7,879 Reported direct emissions (billion metric tons CO2e) 3.18 Suppliers of fuel and industrial gases Number of suppliers 965 Underground injection of carbon dioxide Number of carbon dioxide injection facilities 92
- Who reports?
For 2013, 7,865 direct emitters submitted a GHG report. The Petroleum and Natural Gas Systems sector had the largest number of reporting facilities, followed by the Waste Sector and the Power Plants Sector. Among suppliers, Suppliers of Natural Gas and Natural Gas Liquids had the largest number of reporting facilities.
Table 3: Number of Direct Emitters that Reported (2013) Industry Sector Number of Reporters1 Power Plants 1,572 Petroleum and Natural Gas Systems 2,164 Refineries 145 Chemicals 473 • Fluorinated Chemicals 16 • Non-fluorinated Chemicals 457 Waste 1,611 Metals 296 Minerals 376 Pulp and Paper 233 Other 1,399 • Underground Coal Mines 118 • Electrical Equipment Production & Use 127 • Electronics Manufacturing 53 • Other Combustion 1,101 1 Totals sum to more than 7,879 because facilities whose activities fall within more than one sector are counted multiple times.
- Reported Emissions
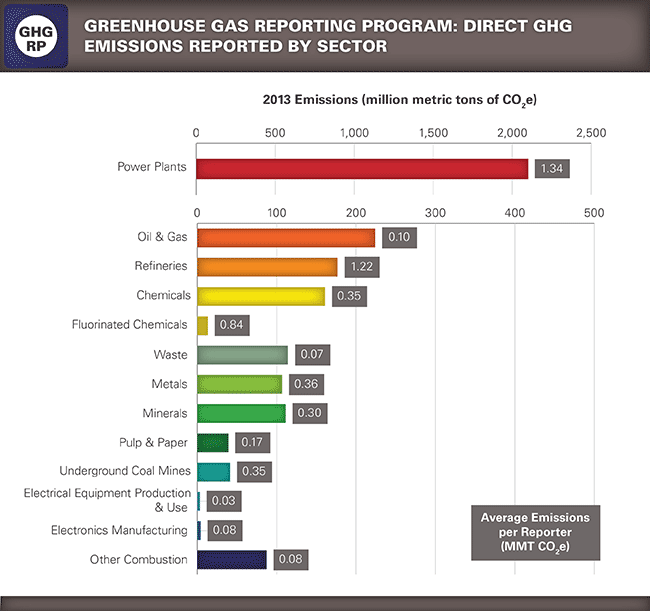
In 2013, 3.18 billion metric tons CO2e were reported by direct emitters. The largest emitting sector was the Power Plant Sector with 2.1 billion metric tons CO2e, followed by the Petroleum and Natural Gas Systems Sector with 224 million metric tons (MMT) CO2e and the Petroleum Refinery Sector with 177 MMT CO2e. This information, as well as average emissions per reporter, is shown in the following chart.
Figure 2: Direct GHG Emissions Reported by Sector (2013)
- Emissions Trends
National level trends in greenhouse gas emissions are available through the Inventory of U.S. Greenhouse Gas Emissions and Sinks: 1990-2012. The Greenhouse Gas Reporting Program is different from the U.S. GHG Inventory in that it collects information from the largest stationary sources in the U.S. and provides nearly complete emissions coverage for many of the largest emitting industries. Trends in emissions reported for individual industries are discussed in the industry-specific reports.
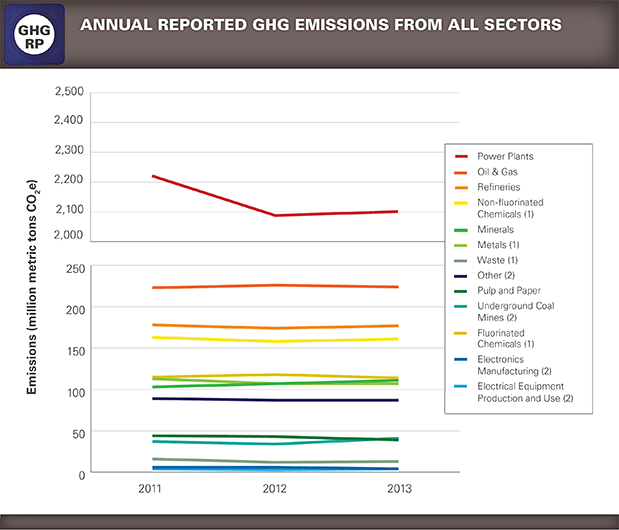
Total U.S. emissions decreased by 3.4% from 2011 to 2012, based on the U.S. GHG Inventory. Between 2011 and 2012, emissions reported to the GHGRP declined by 4.5% (Table 4). This decline was driven by a 4.7% decline in emissions from power plants.
The U.S. GHG Inventory is not yet available for 2013. For sources reporting to the GHGRP, emissions increased by 0.62% from 2012 to 2013; this increase was driven by a similar increase in power plant emissions. Over the past three reporting years (2011-2013), GHGRP reported emissions have declined by 3.9%. This decline is caused primarily by a 5.4% decline in reported emissions by power plants. Since 2010, emissions from power plants have decreased by 9.8%.
Table 4: Emissions Trends for U.S. GHG Inventory and GHGRP (2011-2013) 2011 2012 2013 U.S. GHG Inventory Total emissions (million metric tons CO2e) 6,753 6,525.6 Not available Percent change in emissions from previous year -1.77% -3.37% Not available GHGRP Number of direct-emitting facilities 7,592 7,808 7,879 Direct emissions (million metric tons CO2e) 3,314.2 3,164.8 3,184.3 Percent change in emissions from previous year — -4.5% 0.6% Table 5: Emission Trends by Sector (2011-2013) Sector 2011 Emissions
(MMT CO2e)2012 Emissions
(MMT CO2e)12013 Emissions
(MMT CO2e)Power Plants 2,221.3 2,088.1 2,100.9 Oil & Gas 223.1 226.4 224.1 Refineries 178.3 174.0 176.7 Chemicals 179.2 170.9 174.6 • Fluorinated Chemicals 15.7 12.4 13.5 • Non-fluorinated Chemicals 163.5 158.5 161.1 Waste 115.4 118.5 114.0 Metals 112.8 106.9 106.8 Minerals 103.2 107.5 111.3 Pulp & Paper 44.2 42.5 39.1 Other 136.8 130.0 136.9 • Underground Coal Mines 37.1 34.0 41.5 • Electrical Equipment Production & Use 4.3 3.5 3.5 • Electronics Manufacturing 6.1 5.6 4.5 • Other Combustion 89.3 86.9 87.4 Figure 3: Trends in Direct GHG Emissions (2011-2013)
View this information in FLIGHT.
(1) Non-fluorinated Chemicals and Fluorinated Chemicals are components of “Chemicals” in FLIGHT.
(2) Other Combustion, Underground Coal Mines, Electronics Manufacturing and Electrical Equipment Production & Use comprise “Other” in FLIGHT.
- Emissions by GHG
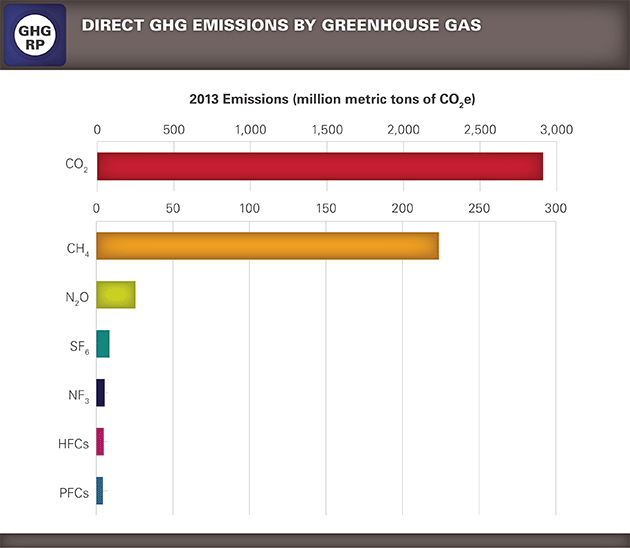
Carbon dioxide is the GHG emitted in the largest quantities. The 2.9 billion metric tons of CO2 reported for 2013 represent 91.4% of the GHGs reported in 2013.a Methane emissions represent about 7% of reported 2013 GHG emissions, N2O represents about 0.8%, and fluorinated gases (HFCs, PFCs, SF6) represent about 0.7% (Figure 4).
aThe Inventory of U.S. Greenhouse Gas Emissions And Sinks for 2013 is not yet available. In 2012, CO2 represented 54% of total U.S. GHG emissions.
Figure 4: Direct Emissions by GHG (2013)
The table below lists the primary sectors emitting each GHG.
1 These source categories account for 75% or more of the reported emissions of the corresponding GHG. The subpart under which the emissions were reported is shown in parentheses.Table 6: Largest Sources of GHG Emissions Greenhouse Gas Source Categories Contributing Most to Emissions1 Sectors Contributing Most to Emissions CO2 Electricity Generation (D), Stationary Combustion (C) Power Plants CH4 Municipal Landfills (HH), Petroleum & Natural Gas Systems (W) Waste, Petroleum & Natural Gas Systems N2O Nitric Acid Production (V), Electricity Generation (D), Adipic Acid Production (E) Chemicals, Power Plants SF6 SF6 from Electrical Equipment (DD), Magnesium Production (T) Other, Metals NF3 Electronics Manufacturers (I) Other HFCs HCFC–22 Production and HFC–23 Destruction (O) Chemicals PFCs Aluminum Production (F), Electronics Manufacturers (I) Metals, Other
- Geographic Distribution of Emissions
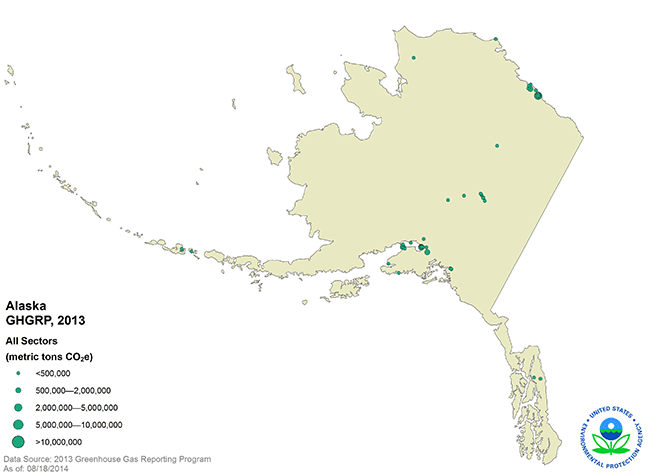
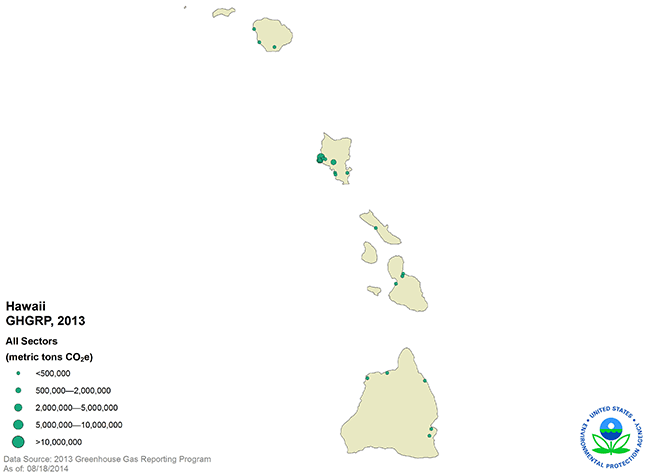
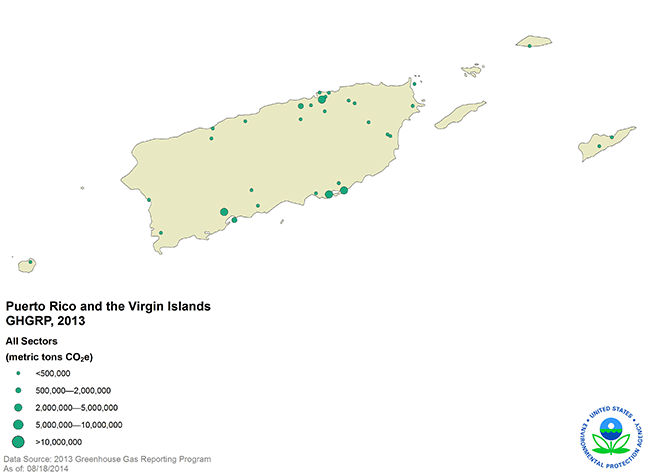
Figure 5: Location and Total Reported Emissions from GHGRP Facilities (2013)
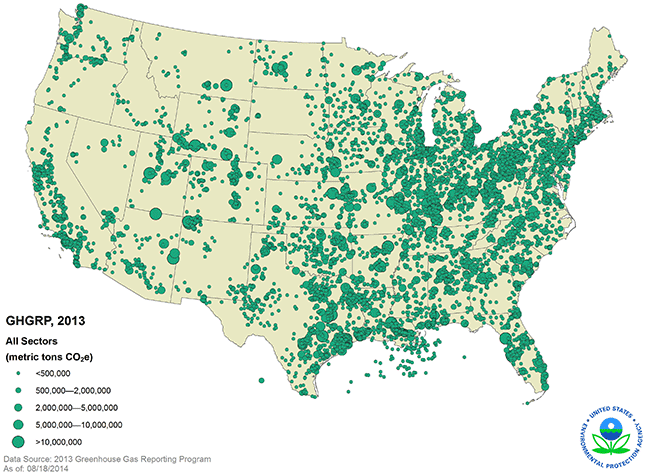
This map shows the locations of direct-emitting facilities. The size of a circle corresponds to the quantity of emissions reported by that facility. There are also facilities located in Alaska, Hawaii, Puerto Rico, the U.S. Virgin Islands, and Guam.
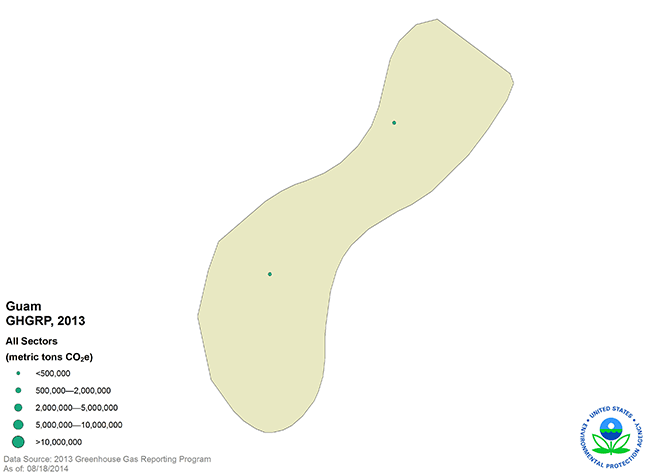
Readers can identify facilities in their state, territory, county, or city by visiting FLIGHT.
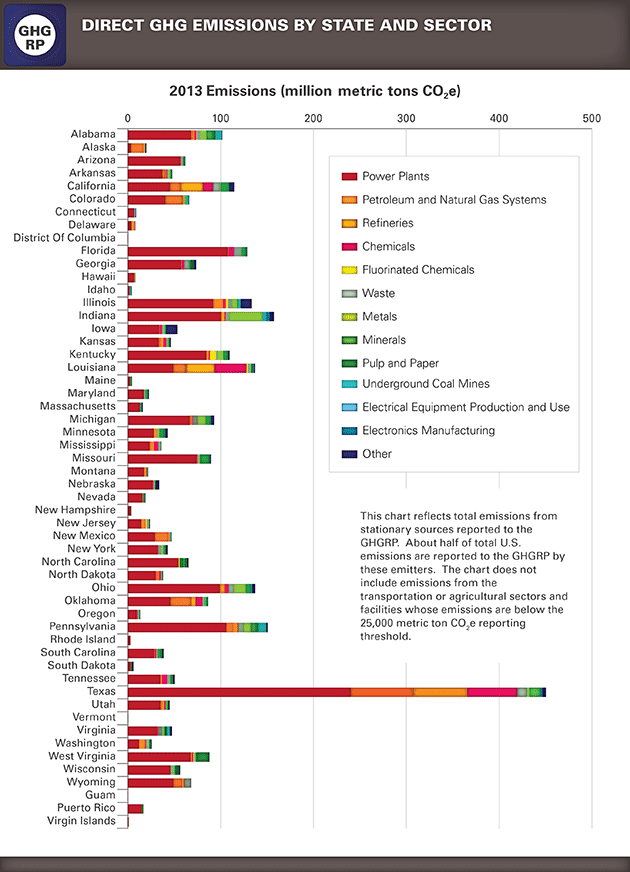
Because it generally applies to facilities that emit greater than 25,000 metric tons CO2e per year, the GHGRP provides total reported emissions from large stationary sources in each state. Figure 6 shows the reported emissions in each state broken out by industrial sector.
Figure 6: Direct GHG Emissions by State and Sector (2013)
- Emissions Range
The GHGRP provides a comprehensive dataset that can be used to determine the number of facilities at various emissions levels in many industry sectors. The GHGRP can also be used to determine the total GHG emissions from individual facilities, including emissions from fossil fuel combustion and other processes. This information is valuable for planning future policies. GHGRP data provide policy makers with a better understanding of the number of facilities and total emissions that would be covered by potential GHG reduction policies for various industries.
Figure 7: Percentage of All Reporting Facilities at Various Emission Ranges (2013)
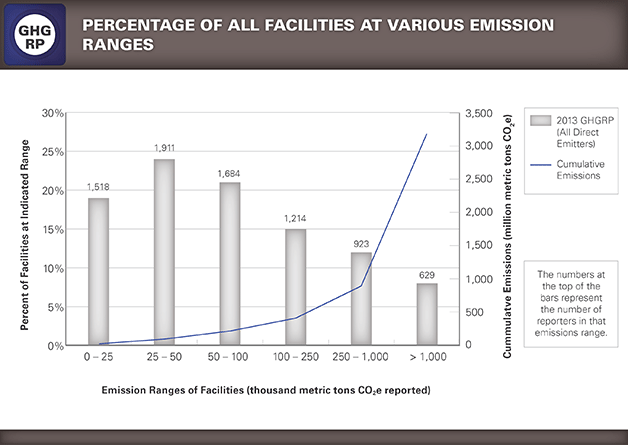
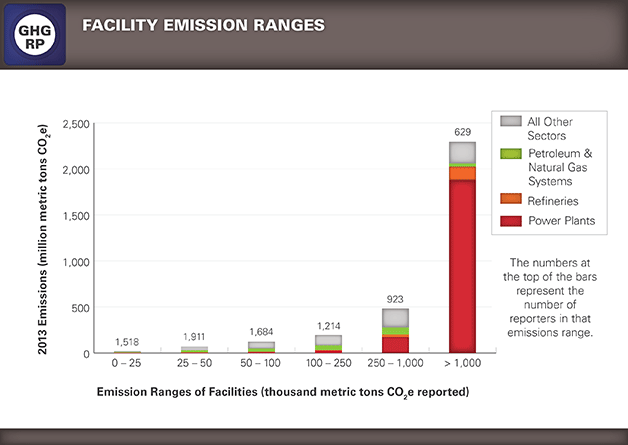
Eighty percent of reporting facilities had emissions less than 250,000 metric tons CO2e. In 2013, the 629 largest-emitting facilities—those emitting more than one million metric tons CO2e—accounted for almost 2.3 billion metric tons CO2e. These emissions represent 84.8% of the total 3.18 billion metric tons CO2e reported. These high-emitting facilities are mainly Power Plants, but also include Petroleum Refineries and facilities in the Chemicals and Metals sectors.
You can use FLIGHT to list and sort facilities based on total reported emissions and find the largest emitting facilities in the country or a specific state or county. This tool also allows you to sort facilities by specific industry types.
Figure 8: Facility Emission Ranges (2012)
- GHGRP Calculation Methods Used
The GHGRP prescribes methodologies that must be used to determine GHG emissions from each source category. Reporters generally have the flexibility to choose among several methods to compute GHG emissions. The decision of which method to use may be influenced by the existing environmental monitoring systems in place and other factors. Reporters can change emission calculation methods from year to year and within the same year, as long as they meet the requirements for use of the method selected.
For additional information on the methodologies that reporters use to determine GHG emissions, please read the GHGRP Methodology Factsheet.
- Report Verification
All reports submitted to EPA are evaluated by electronic validation and verification checks. If potential errors are identified, EPA will notify the reporter, who can resolve the issue either by providing an acceptable response describing why the flagged issue is not an error or by correcting the flagged issue and resubmitting their annual GHG report.
For additional information describing EPA’s verification process in more details, please read the GHGRP Verification Factsheet.
- For More Information
For more detailed information from each industrial sector, view the GHGRP Data Highlights and select an industry from the text box on the right hand side.
Use FLIGHT to view maps of facility locations, obtain summary data for individual facilities, create customized searchers, and display search results graphically.
Downloadable spreadsheets containing summary data reported to the GHGRP from each reporter are available on the Data Downloads page.
All other publicly available data submitted to the GHGRP are available for download through Envirofacts.
The U.S. Greenhouse Gas Inventory contains information on all sources of GHG emissions and sinks in the United States from 1990 to 2012.
All GHG emissions data reflect the global warming potential (GWP) values from the Fourth Assessment Report (AR4) of the Intergovernmental Panel on Climate Change (Climate Change 2007: The Physical Science Basis. Contribution of Working Group I to the Fourth Assessment Report of the Intergovernmental Panel on Climate Change [Core Writing Team, Pachauri, R.K. and Reisinger, A. (eds)]. IPCC, Geneva, Switzerland, 2007). The AR4 values also can be found in the current version of Table A-1 in subpart A of 40 CFR part 98.