GHGRP 2013: Chemicals
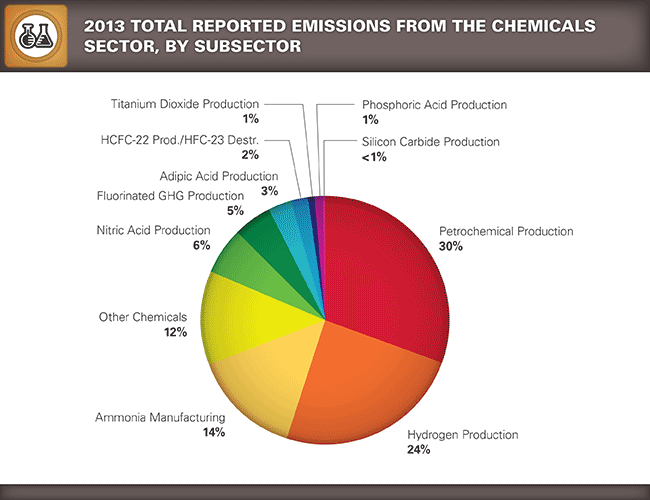
 The chemical manufacturing sector consists of facilities that manufacture organic or inorganic chemicals. For this summary, the sector is broken down into facilities that produce fluorinated chemicals and non-fluorinated chemicals. The non-fluorinated chemicals subsector comprises facilities that produce adipic acid, ammonia, hydrogen (both merchant and non-merchant plants), nitric acid, petrochemicals, phosphoric acid, silicon carbide, and titanium dioxide. The fluorinated chemicals subsector comprises facilities that produce HCFC-22 (or destroy HFC-23) and other fluorinated chemicals. A more detailed description of these subsectors is provided below. A total of 473 chemicals facilities reported in 2013.
- Trend of Annual Reported GHG Emissions for Chemicals (All Subsectors) (as of 8/18/14).
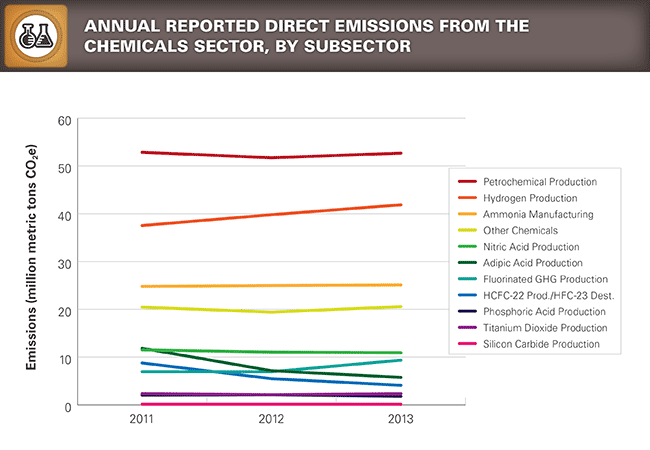
The emission trend for fluorinated gas production is affected by the use of different GWPs in 2013 than in 2011 and 2012. This inconsistency in GWPs is expected to be removed in the near future. To date, fluorinated gas producers have reported their emissions only in terms of CO2e under temporary reporting provisions. Under a rule proposed in November, 2013, fluorinated gas producers would submit full reports for all past years using a single set of GWPs.
| Chemicals Sector — Greenhouse Gas Emissions Reported to the GHGRP (all emissions values presented in million metric tons CO2e) |
|||
| 2011 | 2012 | 2013 | |
|---|---|---|---|
| Number of facilities: | 458 | 467 | 473 |
| Total emissions (CO2e): | 179.2 | 170.9 | 174.6 |
| Emissions by greenhouse gas (CO2e)
|
142.8 0.4 21.2 14.9 |
142.8 0.2 16.2 11.7 |
146.9 0.2 14.9 12.7 |
Emissions by subsector
|
163.5 15.7 |
158.5 12.4 |
161.1 13.5 |
Totals may not equal sum of individual GHGs due to independent rounding..
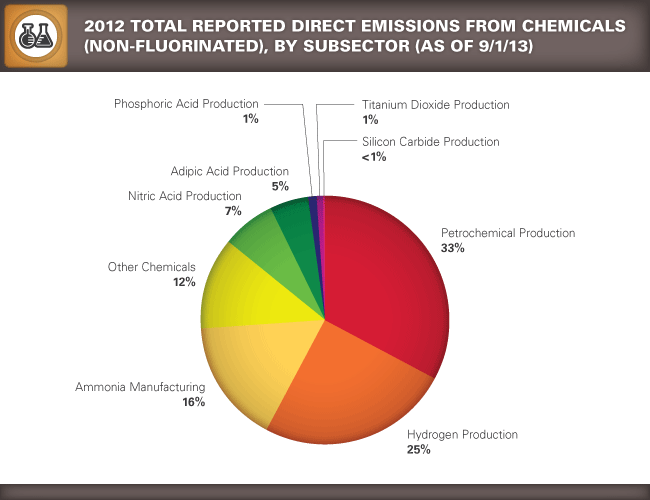
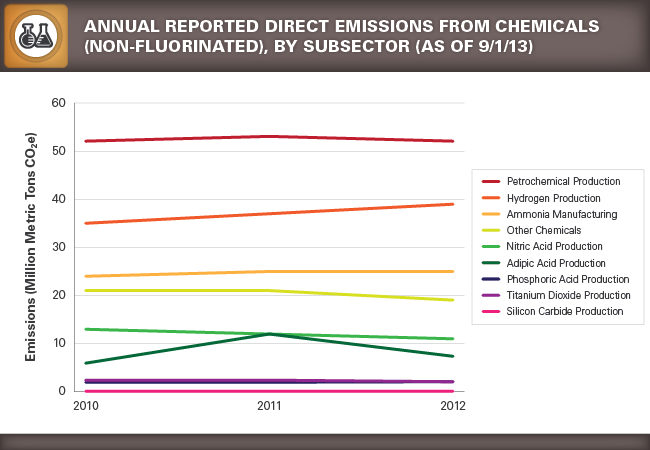
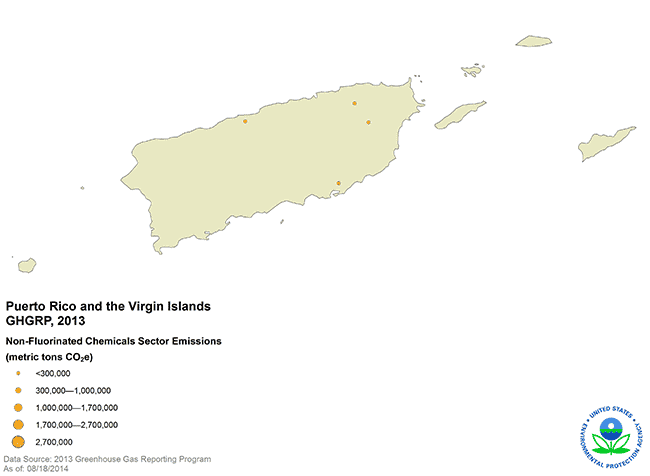
Chemicals (Non-fluorinated)
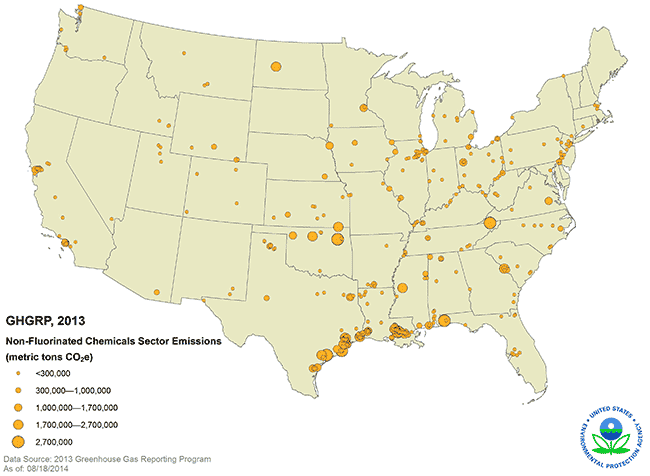
The chemical manufacturing sector consists of facilities that produce adipic acid, ammonia, hydrogen (both merchant and non-merchant plants), nitric acid, petrochemicals (acrylonitrile, carbon black, ethylene, ethylene dichloride, ethylene oxide, methanol), phosphoric acid, silicon carbide, soda ash, and titanium dioxide. Besides the emissions from these chemical production processes, the sector includes combustion emissions from facilities that produce pesticides, fertilizer, pharmaceuticals, and other organic and inorganic chemicals. A total of 457 facilities reported 2013 emissions under this subsector. A small number of facilities in this sector collect CO2 either for use in their other production processes, to transfer to other users, or to sequester or otherwise inject underground; this sector includes the CO2 from those process emissions. For example, some of the process emissions reported for ammonia manufacturing plants includes CO2 that is later consumed on site for urea production. This CO2 is not released to the ambient air from the ammonia manufacturing process unit(s).
| Chemicals (Non-Fluorinated) Subsectors — Greenhouse Gas Emissions Reported to the GHGRP (all emissions values presented in million metric tons CO2e) |
|||
| 2011 | 2012 | 2013 | |
|---|---|---|---|
| Number of facilities: | 442 | 451 | 457 |
| Total emissions (CO2e): | 163.5 | 158.5 | 161.1 |
| Emissions by greenhouse gas (CO2e)
|
141.9 0.4 21.2 |
142.1 0.2 16.2 |
146.0 0.2 14.9 |
Totals may not equal sum of individual GHGs due to independent rounding.
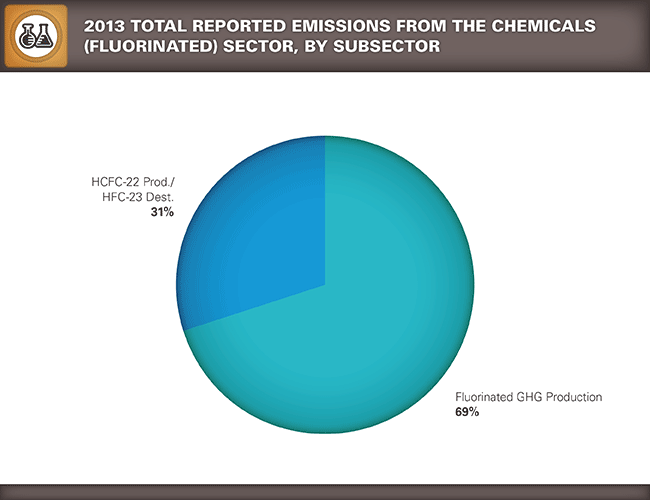
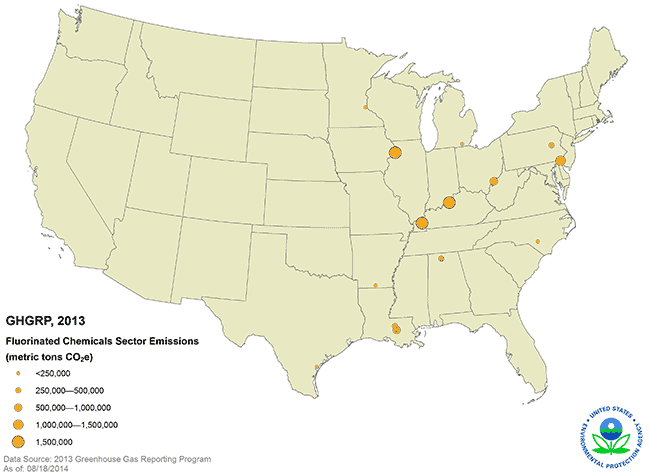
Fluorinated Chemicals
The fluorinated chemical subsector includes facilities that produce hydrofluorocarbons (HFCs), perfluorocarbons (PFCs), sulfur hexafluoride (SF6), nitrogen trifluoride (NF3), other fluorinated GHGs such as fluorinated ethers, and chlorofluorocarbons (CFCs) and hydrochlorofluorocarbons (HCFCs), including chlorodifluoromethane (HCFC-22). The category also includes facilities that destroy HFC-23, which is a by-product of HCFC-22 production and which may be emitted from the destruction process. This subsector does not include industries that use these fluorinated GHGs (i.e. semiconductors).
- Trend of Annual Reported GHG Emissions from Fluorinated Chemicals, by Subsector (as of 8/18/14).
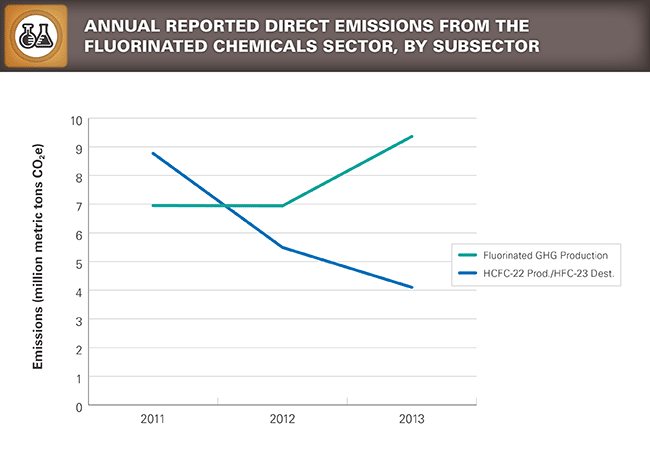
As noted above, the emission trend for fluorinated gas production is affected by the use of different GWPs in 2013 than in 2011 and 2012.
| Fluorinated Chemicals Subsector — Greenhouse Gas Emissions Reported to the GHGRP (all emissions values presented in million metric tons CO2e) |
|||
| 2011 | 2012 | 2013 | |
|---|---|---|---|
| Number of facilities: | 16 | 16 | 16 |
| Total emissions (CO2e): HCFC-22 Production/HFC-23 Destruction Other Fluorinated Gas Production |
15.7 8.8 6.9 |
12.4 5.5 6.9 |
13.5 4.1 9.4 |
| Emissions by greenhouse gas (CO2e)
|
0.9 ** ** 14.9 |
0.7 ** ** 11.7 |
0.8 ** ** 12.7 |
Totals may not equal sum of individual GHGs due to independent rounding.
** Total reported emissions are less than 0.05 million metric tons CO2e.