GHGRP 2013: Pulp and Paper
 The pulp and paper sector consists of facilities that produce market pulp or that manufacture pulp and paper. Facilities that have pulping processes report the GHG emissions from chemical recovery units, lime kilns, and stationary fuel combustion units. In addition to emissions from pulp production processes, the sector includes combustion emissions from facilities that produce paper products from purchased pulp, produce secondary fiber from recycled paper, convert paper into paperboard products, operate coating and laminating processes, print products (such as books, labels, business cards, stationery, and business forms), and perform support activities (such as data imaging, plate-making services, and bookbinding). Emissions from industrial landfills and industrial wastewater treatment at facilities in the pulp and paper sector are included in the waste sector.
- Trend of Annual Reported GHG Emissions by Subsector (as of 8/18/14)
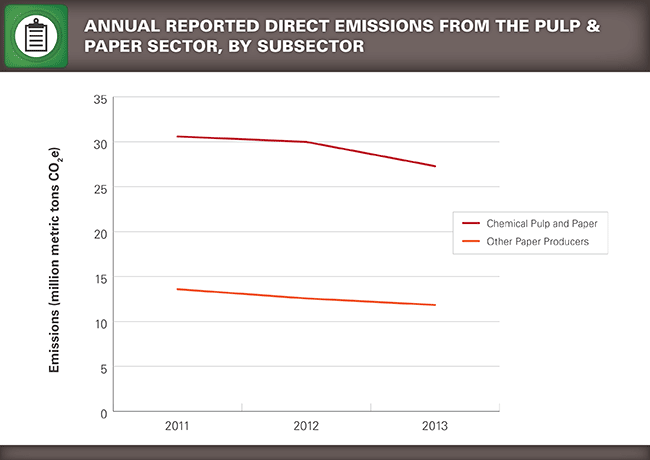
Overall, emissions from the pulp and paper sector declined by eight percent from 2012 to 2013. Most of the decline occurred in the chemical pulp and paper subsector, where emissions declined by nine percent. The emission trends observed between 2012 and 2013 appear to be declining, which could be attributed to changes in production levels and fuel use. However, the more pronounced decline in emissions from chemical pulp and paper facilities between 2012 and 2013 can in part be attributed to a change in the emission factors used to estimate methane and nitrous oxide emissions from the combustion of spent pulping liquor and wood residuals. For reporting year 2013, EPA updated these emission factors based on review of emissions test data submitted to the EPA and other relevant literature.1 These new emission factors used for reporting year 2013, but not for prior years, contributed to a decline in reported methane and nitrous oxide emissions from the pulp and paper industry. This decline in methane and nitrous oxide emissions resulted in an approximately five percent decline in total emissions from this sector. The rest of the observed decline is due to changes in production levels and fuel use in the industry.
1 Memorandum from K. Hanks and C. Gooden, RTI to M. Hannan, U.S. EPA. January 9, 2013. Kraft Pulping Liquor and Woody Biomass Methane (CH4) and Nitrous Oxide (N2O) Emission Factor Literature Review. EPA-HQ-OAR-2012-0934-0012.
| Pulp and Paper Sector — Greenhouse Gas Emissions Reported to the GHGRP (all emissions values presented in million metric tons CO2e) |
|||
| 2011 | 2012 | 2013 | |
|---|---|---|---|
| Number of facilities: | 233 | 233 | 233 |
| Total emissions (CO2e): | 44.2 | 42.5 | 39.1 |
| Emissions by greenhouse gas (CO2e)
|
41.2 1.1 1.9 |
39.6 1.1 1.9 |
38.2 0.2 0.7 |
Totals may not equal sum of individual GHGs due to independent rounding.
CO2 emissions from the combustion of biomass are NOT included in emissions totals provided above.
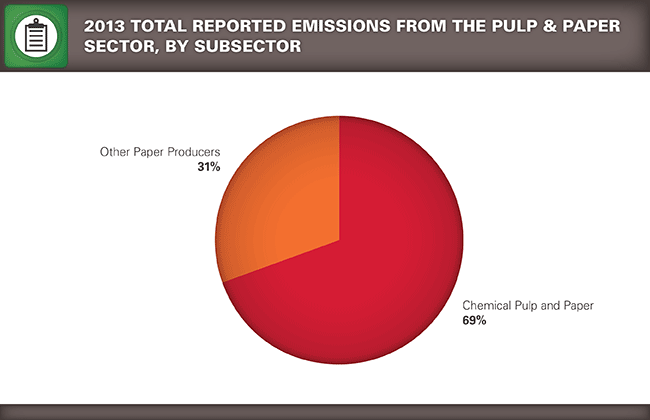
| Number of reporters and 2013 emissions (CO2e) per pulp and paper industry subsector | ||
| Industry Sector | 2013 Number of Reporters | 2013 Emissions (million metric tons CO2e) |
|---|---|---|
|
110 123 |
27.3 11.8 |