EnviroAtlas Data Organization
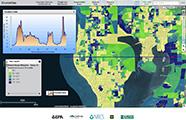
EnviroAtlas data are organized according to their type and spatial extent. The image below is an example of how the data are first organized by type in the Interactive Map.
 A partial screenshot of the EnviroAtlas Interactive Map with data menus outlined in red.
Ecosystem Services and Biodiversity
Ecosystem Services and Biodiversity data are first organized according to whether they are National, Community, or Ecosystem Markets components. The National and Community components are then organized into seven ecosystem services benefit categories (below). They are further subdivided within each category.
- Clean Air
- Clean and Plentiful Water
- Natural Hazard Mitigation
- Climate Stabilization
- Recreation, Culture, and Aesthetics
- Food, Fuel, and Materials
- Biodiversity Conservation
Ecosystem Markets data are organized according to type – watersheds, imperiled species and habitats, forest carbon, wetlands and streams, enabling conditions —and by data type – point or polygon.
- Market initiatives polygon data are grouped into layers based on the scales at which initiatives operate - national, regional, state, and local - but they are not summarized by a specific spatial unit.
- Market initiatives point data represent market initiatives operating at all scales.
- Polygon data showing conditions that enable markets are grouped based on the scales at which the conditions or policies operate - national, federal lands, regional, state, and watershed - but they are not summarized by a specific spatial unit.
Note: Data layers may be linked to multiple ecosystem services and thus may be found under multiple benefit categories in the map.
People and Built Spaces
This menu contains data related to the built environment with separate sections for demographics for the National and Community components.
- National Demographics: The demographic data for the nation are summarized by census tract, and use the 2006-2010 American Community Survey data and the 2010 US Census tract boundaries. Other sources of data are also included.
- People and Built Spaces - National: These data are related to location efficiency. Approximately 40 data layers summarizing demographic, employment, and built environment variables are available for every census block group (CBG) in the U.S. Many of these maps are from EPA's Smart Location Database. Learn more about smart location mapping.
- People and Built Spaces - Community: For selected communities included in the community component of EnviroAtlas, demographic data are available by census block group. These data are from the 2010 Census and the 2006-2010 American Community Survey and use the 2010 U.S. Census block group boundaries. Other sources of data are also included.
Supplemental Maps
Supplemental Maps are organized into the following five sections:
- Boundaries: Includes physical boundaries for EnviroAtlas communities, watersheds, political areas, and ecological regions. Also includes Protected Areas Database of the U.S. (PAD-US) and Ecoregions.
- Biophysical Vector Data: Includes the National Hydrography Dataset, Connectivity Data, Gap Analysis Program (GAP) ecological systems, soils data, and data from the National Wetlands Inventory.
- Land Cover and Biophysical Data - Raster - Community: Includes land cover and forest connectivity data for available communities.
- Land Cover and Biophysical Data - Raster - National: Includes land cover, dasymetric data, rare ecosystems, and potentially restorable wetlands at the national extent.
- EPA Waters Data: Includes data for EPA 303(d) Impaired and Assessed waters.

