EnviroAtlas Data Approach
EnviroAtlas Uses an Indicator and Index Approach to Ecosystem Services
- We select and develop indicators for their ability to provide information about a particular ecosystem service.
- Many of the indicators are not a direct measurement of a specific ecosystem service but rather provide one piece of a complex puzzle of information.
- Indicators have been selected for their ability to describe provision, benefits and beneficiaries, and drivers of change of ecosystem services.
- Some of the community data gets closer to ecosystem services measurements than does the national data because models have been developed that can be applied at the community scale.
- Taken collectively, a group of indicators can get closer to an ecosystem service quantification, EnviroAtlas is adding tools allowing the user to take a group of indicators and combine them into an index.
- The EnviroAtlas team is continuing to develop more robust indicators.
EnviroAtlas Relies on Foundational Data
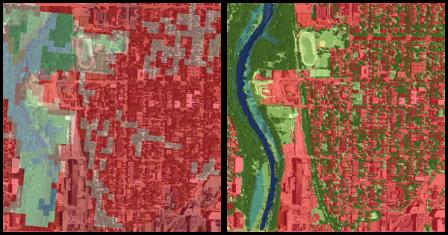
 In downtown Milwaukee, WI (1:6000), the 30m NLCD dataset (left) presents a coarse, pixelated picture with a majority of developed (red) land cover. By contrast, the 1m EnviroAtlas community data (right) provides a clearer picture that reveals more natural land cover, such as water (blue) and trees (dark green).The development of indicators relies on the availability of nationally and locally available data sets which provide inputs to models and calculations.
- EnviroAtlas supports the development of some data sets that provide important inputs.
- Land cover, for example, is a critical data set that is necessary for the computation of many of the EnviroAtlas data layers.
- EnviroAtlas supports the development of the National Land Cover Dataset (NLCD)Exit, a 30 meter resolution product.
- We also develop the high resolution land cover, a 1 meter resolution product, that is used for the selected communities.
- For investigating changes over time, it is important to have land cover data available for multiple time periods.
- NLCD is produced every 5 years.
- Other data sets such as stream hydrography, soils, demographics, topography, and economic data, in combination with land cover, are used to produce our indicators.
