ACE: Biomonitoring - Phthalates
Indicator B9
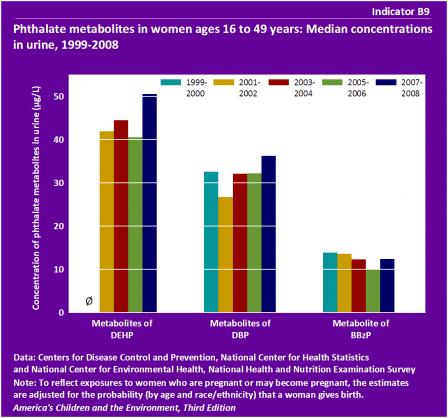 ø The estimate is not reported because the metabolites MEOHP and MEHHP were not measured in 1999-2000.
Data characterization
- Data for this indicator are obtained from an ongoing continuous survey conducted by the National Center for Health Statistics.
- Survey data are representative of the U.S. civilian noninstitutionalized population.
- Phthalate metabolites are measured in urine samples obtained from individual survey participants.
- From 2001-2002 to 2007-2008, the median level of DEHP metabolites in urine of women ages 16 to 49 years varied between 41 µg/L and 51 µg/L, and was 51 µg/L in 2007-2008. There was no statistically significant trend in median DEHP metabolites over 2001-2002 to 2007-2008.
- From 1999-2000 to 2007-2008, the median level of DBP metabolites in urine of women ages 16 to 49 years varied between 27 µg/L and 36 µg/L, and was 36 µg/L in 2007-2008.
- From 1999-2000 to 2007-2008, the median level of BBzP metabolites in urine of women ages 16 to 49 years varied between 10 µg/L and 14 µg/L, and was 12 µg/L in 2007-2008.
- From 2001-2002 to 2007-2008, the concentration of DEHP metabolites in the 95th percentile varied between 462 µg/L and 578 µg/L, and was 567 µg/L in 2007-2008. There was an increasing trend in the 95th percentile concentration of DBP metabolites in women of child-bearing age, from 128 µg/L in 2001-2002 to 160 µg/L in 2007-2008. From 1999-2000 and 2007-2008, the concentration of BBzP metabolite varied between 68 µg/L and 100 µg/L, and was 70 µg/L in 2007-2008. (See Table B9a.)
- The increasing trend for DBP metabolites at the 95th percentile from 2001-2002 to 2007-2008 was statistically significant after accounting for differences by age, race/ethnicity, and income.
- The increasing trend for DBP metabolites at the 95th percentile from 2001-2002 to 2007-2008 was statistically significant after accounting for differences by age, race/ethnicity, and income.
- The concentrations of DEHP metabolites in the 95th percentile ranged from 10 to 14 times higher than the median levels presented in this graph. The concentrations of DBP metabolites and BBzP metabolite in urine at the 95th percentile ranged from 4 to 7 times higher than the median levels presented in this graph. (See Table B9 and B9a.)
- For the years 2005-2008, Black non-Hispanic women of child-bearing age had higher median concentrations of all the phthalate metabolites shown here compared with White non-Hispanic women, Mexican-American women, and women of “All Other Races/Ethnicities,” although these differences were frequently not statistically significant. (See Table B9b.)
- Median levels of urinary phthalate metabolites varied by family income. Women living below poverty level had higher concentrations of phthalate metabolites in their urine compared with women living at or above poverty level. (See Table B9b.)
- The difference between income groups was statistically significant for the DBP metabolites after accounting for differences by race/ethnicity or age profile above and below poverty. The difference between income groups for the BBzP metabolite was statistically significant before accounting for race/ethnicity and age. The difference between income groups was not statistically significant for the DEHP metabolites.
Indicator B10
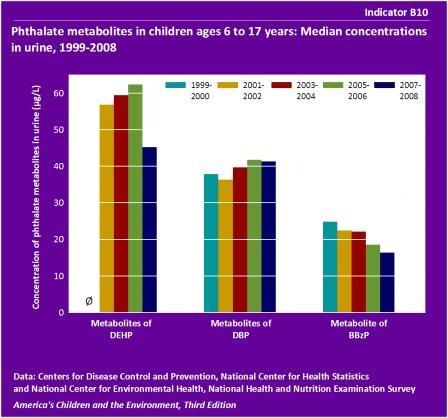 ø The estimate is not reported because the metabolites MEOHP and MEHHP were not measured in 1999-2000.
Data characterization
- Data for this indicator are obtained from an ongoing continuous survey conducted by the National Center for Health Statistics.
- Survey data are representative of the U.S. civilian noninstitutionalized population.
- Phthalate metabolites are measured in urine samples obtained from individual survey participants.
- From 2001-2002 to 2007-2008, the median level of DEHP metabolites in urine of children ages 6 to 17 years varied between 45 µg/L and 62 µg/L, and was 45 µg/L in 2007-2008.
- From 1999-2000 to 2007-2008, the median level of DBP metabolites in urine of children ages 6 to 17 years varied between 36 µg/L and 42 µg/L, and was 41 µg/L in 2007-2008.
- The median level of BBzP metabolite in urine of children ages 6 to 17 years decreased from 25 µg/L in 1999-2000 to 16 µg/L in 2007-2008. This decreasing trend was statistically significant.
- At the 95th percentile, there was an increasing trend in the concentration of DEHP metabolites in children, from 387 µg/L in 1999-2000 to 564 µg/L in 2007-2008. From 1999-2000 to 2007-2008, the concentration of DBP metabolites varied between 166 µg/L and 191 µg/L, and was 191 µg/L in 2007-2008. The concentration of BBzP metabolites varied between 104 µg/L and 151 µg/L, and was 107 µg/L in 2007-2008. (See Table B10a.)
- The increasing trend for DEHP metabolites from 1999-2000 to 2007-2008 was statistically significant.
- Among children ages 6 to 17 years, the concentration of DEHP metabolites in urine at the 95th percentile ranged from 7 to 12 times higher than the median levels presented in this graph. The concentrations of metabolites of DBP and BBzP in the 95th percentile ranged from 4 to 7 times higher than the median levels. (See Table B10 and B10a.)
- Children living below poverty level had higher median concentrations of DBP metabolites detected in their urine compared with children living at or above poverty level. Median concentrations of DEHP metabolites and BBzP metabolite were similar among children living below poverty level and children living at or above poverty level. (See Table B10b.)
- The difference between income groups for DBP metabolites was statistically significant.
- The difference between income groups for DBP metabolites was statistically significant.
- For the years 2005-2008, Mexican-American children had lower median concentrations of all the phthalate metabolites shown here compared with White non-Hispanic children and Black non-Hispanic children. (See Table B10b.)
- Testing for differences by race/ethnicity found that Mexican-American children had statistically significantly lower median concentrations of phthalate metabolites as follows: for DEHP and BBzP, lower than both White non-Hispanic and Black non-Hispanic children; for DBP, lower than Black non-Hispanic children, and lower than White non-Hispanic children after accounting for differences in age, sex, and income.
- Testing for differences by race/ethnicity found that Mexican-American children had statistically significantly lower median concentrations of phthalate metabolites as follows: for DEHP and BBzP, lower than both White non-Hispanic and Black non-Hispanic children; for DBP, lower than Black non-Hispanic children, and lower than White non-Hispanic children after accounting for differences in age, sex, and income.
- Children ages 6 to 10 years had higher median levels of phthalate metabolites in their urine compared to adolescents ages 16-17 years. These differences were relatively small for DEHP metabolites and DBP metabolites but greater for BBzP metabolite. (See Table B10c.)
- The age group differences for BBzP were statistically significant.
About the Phthalates Indicators
Indicators B9 and B10 present information about phthalate metabolite levels measured in women and children. The data are from a national survey that collects urine specimens from a representative sample of the population every two years, and then measures the concentration of various contaminants in urine. These indicators focus on both women of child-bearing age and children because of concern for potential adverse effects in children born to women who have been exposed to phthalates and in children exposed to phthalates.
- Indicator B9 presents concentrations of phthalate metabolites in urine of women ages 16 to 49 years from 1999-2008.
- Indicator B10 presents concentrations of phthalate metabolites in urine of children ages 6 to 17 years from 1999-2008.
Phthalates are a class of manufactured chemicals commonly used to increase the flexibility of plastics in a wide array of consumer products. By far the most common use of phthalates is in the production of polyvinyl chloride (PVC) products—PVC is the second most commonly used plastic in the world, and is present in pipes and tubing, construction materials, packaging, electrical wiring, and thousands of consumer goods. Phthalates may be found in wall coverings, tablecloths, floor tiles, furniture upholstery, pesticides, some toys, automobile upholstery, food packaging, cosmetics, hair and skin care products, and some medications. Phthalates are not strongly bound in these products and can therefore leach out. The major route of human exposure to most phthalates is food ingestion; other routes of exposure include inhalation, drinking contaminated water, and absorption through the skin.
Some phthalates are suspected endocrine disruptors. Endocrine disruptors act by interfering with the biosynthesis, secretion, action, or metabolism of naturally occurring hormones. Given the importance of hormones in human physiology, there is concern in the scientific community over the potential for endocrine disruptors to adversely affect children’s health, particularly in reproduction, development, and behavior. Male laboratory animals exposed to high doses of some phthalates have been known to display elements of “phthalate syndrome,” which includes infertility, decreased sperm count, and changes to reproductive organs. These findings in animal studies, although typically occurring at exposure levels much higher than what the general population may be exposed to, suggest a potential concern for health effects in children as well. The National Research Council (NRC) has concluded that prenatal exposure to certain phthalates produces reproductive tract abnormalities in male rats, and also concluded that the same effects could plausibly occur in humans.
Indicators B9 and B10 present phthalate metabolite levels measured in urine of women and children from the National Health and Nutrition Examination Survey (NHANES). Data are presented for three important phthalates: di-2-ethylhexyl phthalate (DEHP), dibutyl phthalate (di-n-butyl phthalate and di-isobutyl phthalate) (DBP), and butyl benzyl phthalate (BBzP).
More information about phthalates and Indicators B9 and B10 is provided in the Phthalates section of America's Children and the Environment, Third Edition.
Related Links
Agency for Toxic Substances and Disease Registry (ATSDR): Phthalates
Consumer Product Safety Commission (CPSC): Phthalates
U.S. EPA: Phthalates and Cumulative Risk Assessment (National Academy of Sciences Final Report)
U.S. EPA: Phthalates Action Plan Summary
U.S. Food and Drug Administration (FDA): Phthalates and Cosmetic Products
Summary of Methods - Phthalates
The National Center for Health Statistics, a division of the Centers for Disease Control and Prevention, conducts the National Health and Nutrition Examination Surveys (NHANES), a series of U.S. national surveys of the health and nutrition status of the noninstitutionalized civilian population. Interviews and physical examinations are conducted with approximately 10,000 people in each two-year survey cycle. The survey measures phthalate metabolite levels in urine samples collected from NHANES participants. The three phthalate metabolites analyzed are mono-n-butyl phthalate (MBP), mono-benzyl phthalate (MBzP), and the sum of the three metabolites mono-2-ethylhexyl phthalate (MEHP), mono-(2-ethyl-5-oxohexyl) phthalate (MEOHP), and mono-(2-ethyl-5-hydroxyhexyl) phthalate (MEHHP).
Indicator B9 uses the NHANES data to present median concentrations of phthalate metabolites measured in urine of women ages 16 to 49. Indicator B10 uses the NHANES data to present median concentrations of phthalate metabolites measured in urine of children ages 6 to 17 years.
Detailed Methods for Indicators B9 and B10
Metadata for National Health and Nutrition Examination Surveys (NHANES)