ACE: Biomonitoring - Lead
Indicator B1 
Data characterization
- Data for this indicator are obtained from an ongoing continuous survey conducted by the National Center for Health Statistics.
- Survey data are representative of the U.S. civilian noninstitutionalized population.
- Lead is measured in blood samples obtained from individual survey participants.
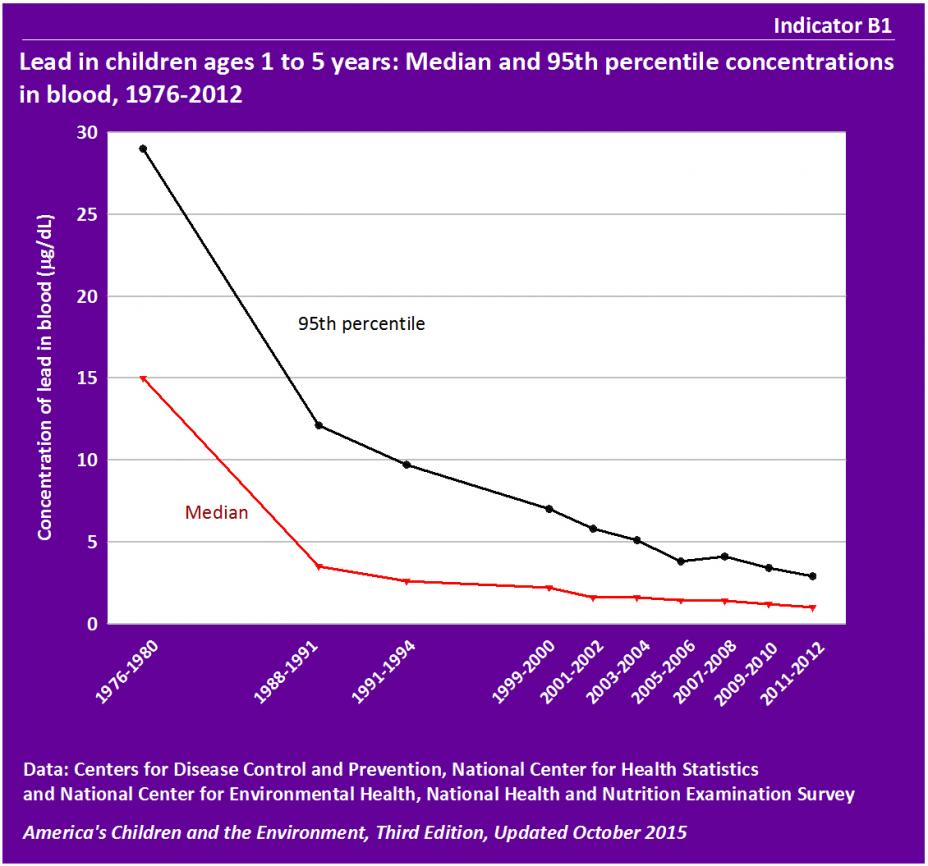
- The median concentration of lead in the blood of children between the ages of 1 and 5 years dropped from 15 µg/dL in 1976–1980 to 1. 0 µg/dL in 2011–2012, a decrease of 93%.
- The concentration of lead in blood at the 95th percentile in children ages 1 to 5 years dropped from 29 µg/dL in 1976–1980 to 2.9 µg/dL in 2011– 2012, a decrease of 90%.
- The largest declines in blood lead levels occurred from the 1970s to the 1990s, following the elimination of lead in gasoline. The data show continuing declines in blood lead levels from 1999–2000 through 2011– 2012, when the primary focus of lead reduction efforts has been on lead-based paint in homes.
- These decreasing trends were all statistically significant, including the trend in both the median and 95th percentile over the most recent 12 years (from 1999–2000 to 2011– 2012).
- In 2011– 2012, median blood lead levels by age group were: 1. 1 µg/dL for age 1 year; 1.0 µg/dL for age 2 years; 0.9 µg/dL for ages 3 to 5 years; 0. 7 µg/dL for ages 6 to 10 years; 0. 5 µg/dL for ages 11 to 15 years; and 0. 5 µg/dL for ages 16 to 17. The 95th percentile blood lead levels were 3.6, 3.5, 2.7, 2.0, 1.3, and 1.5 µg/dL, respectively, for ages 1, 2, 3 to 5, 6 to 10, 11 to 15, and 16 to 17 years. (See Table B1a.)
- The differences among age groups in median and 95th percentile blood lead levels were statistically significant.
Indicator B2
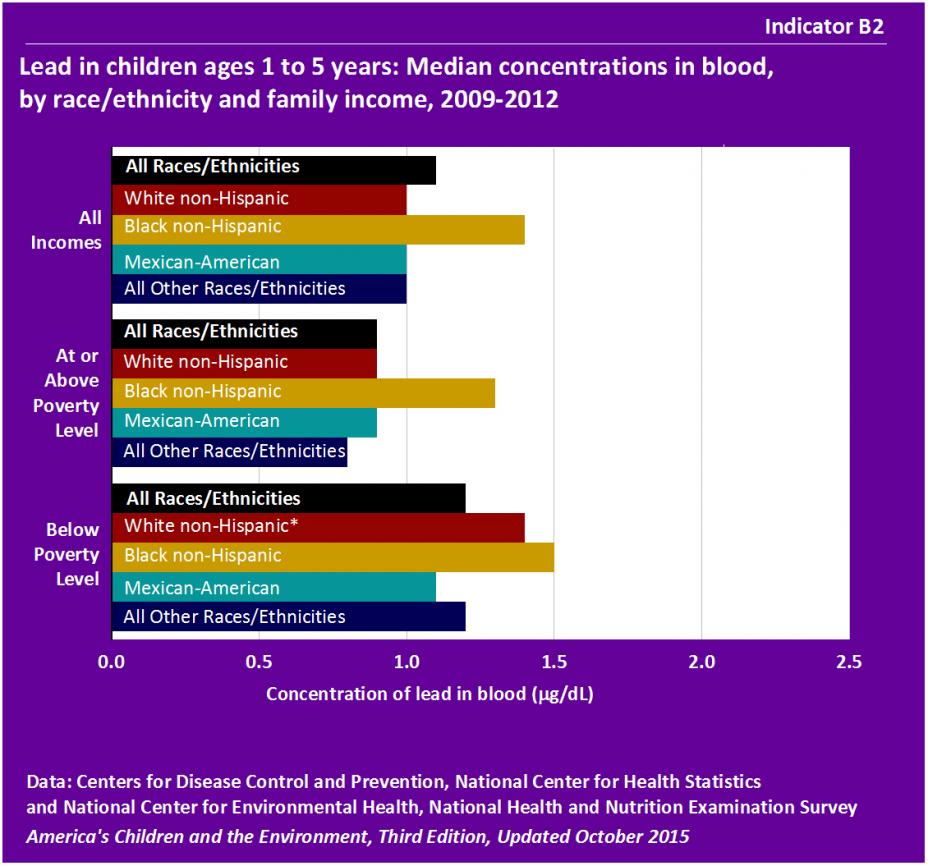 *The estimate should be interpreted with caution because the standard error of the estimate is relatively large: the relative standard error, RSE, is at least 30% but is less than 40% (RSE = standard error divided by the estimate), or the RSE may be underestimated.
Data characterization
- Data for this indicator are obtained from an ongoing continuous survey conducted by the National Center for Health Statistics.
- Survey data are representative of the U.S. civilian noninstitutionalized population.
- Lead is measured in blood samples obtained from individual survey participants.
- The median blood lead level in children ages 1 to 5 years in 2009– 2012 was 1. 1 µg/dL. The median blood lead level in Black non-Hispanic children ages 1 to 5 years in 2009– 2012 was 1. 4 µg/dL, higher than the level of 1. 0 µg/dL in White non-Hispanic children, Mexican-American children, and children of “All Other Races/Ethnicities.”
- The median blood lead level in Black non-Hispanic children was statistically significantly higher than the median level for each of the remaining race/ethnicity groups.
- The median blood lead level for children living in families with incomes below the poverty level was 1. 2 µg/dL, and for children living in families at or above the poverty level it was 0.9 µg/dL, a difference that was statistically significant.
- The median blood lead levels in children ages 1 to 5 years were higher for those in families with incomes below the poverty level compared with those at or above the poverty level within each race/ethnicity group. (See Table B2a.)
- The differences in median blood lead levels between income groups were statistically significant for each race/ethnicity group.
- The 95th percentile blood lead level among all children ages 1 to 5 years was 3. 2 µg/dL. The 95th percentile blood lead level in Black non-Hispanic children ages 1 to 5 years in 2009– 2012 was 4.1 µg/dL, compared with 3. 4 µg/dL for White non-Hispanic children, and 2.6 µg/dL for children of “All Other Races/Ethnicities ” and Mexican-American children. (See Table B2a.)
- The 95th percentile blood lead level in Black non-Hispanic children was statistically significantly higher than the 95th percentile for Mexican-American children and children of “All Other Races/Ethnicities.”
- mong children ages 1 to 5 years in families with incomes below poverty level, the 95th percentile blood lead was 4. 3 µg/dL, and among those in families at or above the poverty level, it was 2.6 µg/dL, a difference that was statistically significant . (See Table B2a.)
- The 95th percentile blood lead levels in children ages 1 to 5 years were higher for those in families with incomes below the poverty level compared with those at or above the poverty level for Black non-Hispanic children, Mexican-American children, and children of “All Other Races/Ethnicities.” (See Table B2a.)
- The difference in 95th percentile blood lead levels between income groups was statistically significant for Mexican-American children after accounting for differences by age and sex.
- Between 1991–1994 and 2009– 2012, median blood lead levels among Black non-Hispanic children ages 1 to 5 years declined 67%: from 4.3 µg/dL to 1. 4 µg/dL. Over the same time period, median blood lead levels among Mexican-American children ages 1 to 5 years declined 68%: from 3.1 µg/dL to 1. 0 µg/dL, and median blood lead levels among White non-Hispanic children ages 1 to 5 years declined 57%: from 2.3 µg/dL to 1. 0 µg/dL. The differences over time were statistically significant for each race/ethnicity. (See Table B2b.)
About the Lead Indicators
Indicators B1 and B2 present information about lead levels measured in children. The data are from a national survey that collects blood specimens from a representative sample of the population every two years, and then measures the concentration of various contaminants in the blood.
- Indicator B1 presents concentrations of lead in blood of children ages 1 to 5 from 1976-2012.
- Indicator B2 presents concentrations of lead in blood of children ages 1 to 5 years, by race/ethnicity and family income, in 2007-2012.
Lead is a naturally occurring metal used in the production of fuels, paints, ceramic products, batteries, solder, and a variety of consumer products. The use of leaded gasoline and lead-based paint was eliminated or restricted in the United States beginning in the 1970s, resulting in substantial reductions in exposure to lead. However, children continue to be exposed to lead due to the widespread distribution of lead in the environment. Currently in the United States, the major source of early childhood lead exposure is lead-contaminated house dust. A major contributor to lead in house dust is deteriorated or disrupted lead-based paint. Current sources of lead in ambient air in the United States include smelters, ore mining and processing, lead acid battery manufacturing, and coal combustion activities such as electricity generation.
The National Toxicology Program (NTP) has concluded that childhood lead exposure is associated with reduced cognitive function. Children with higher blood lead levels generally have lower scores on IQ tests and reduced academic achievement. In addition to the effects on IQ and school performance, research has increasingly focused on the effects of lead on behavior. The NTP concluded that childhood lead exposure is associated with attention-related behavioral problems (such as inattention, hyperactivity, or attention-deficit/hyperactivity disorder) and increased incidence of problem behaviors (including delinquent, criminal, or antisocial behavior). No level of lead exposure has been identified that is without risk of deleterious health effects.
Indicators B1 and B2 present lead levels measured in blood of children from the National Health and Nutrition Examination Survey (NHANES).
More information about lead and Indicators B1 and B2 is provided in the updated Lead section of America's Children and the Environment, Third Edition.
Related Links
Agency for Toxic Substances and Disease Registry (ATSDR): Lead
Centers for Disease Control and Prevention (CDC): Lead
National Toxicology Program (NTP): Health Effects of Low-Level Lead Evaluation
U.S. Department of Housing and Urban Development (HUD): Healthy Homes and Lead Hazard Control
Summary of Methods - Lead
The National Center for Health Statistics, a division of the Centers for Disease Control and Prevention, conducts the National Health and Nutrition Examination Surveys (NHANES), a series of U.S. national surveys of the health and nutrition status of the noninstitutionalized civilian population. Interviews and physical examinations are conducted with approximately 10,000 people in each two-year survey cycle. The survey measures lead levels in blood samples collected from NHANES participants.
Indicator B1 uses the NHANES data to present median and 95th percentile concentrations of lead measured in blood of children ages 1 to 5 years. Indicator B2 uses the NHANES data to present median concentrations of lead measured in blood of children ages 1 to 5 years, stratified by race/ethnicity and family income.
Detailed Methods for Indicators B1 and B2
Metadata for National Health and Nutrition Examination Surveys (NHANES)