ACE: Biomonitoring - Mercury
Indicator B3 
Data characterization
- Data for this indicator are obtained from an ongoing continuous survey conducted by the National Center for Health Statistics.
- Survey data are representative of the U.S. civilian noninstitutionalized population.
- Mercury is measured in blood samples obtained from individual survey participants.
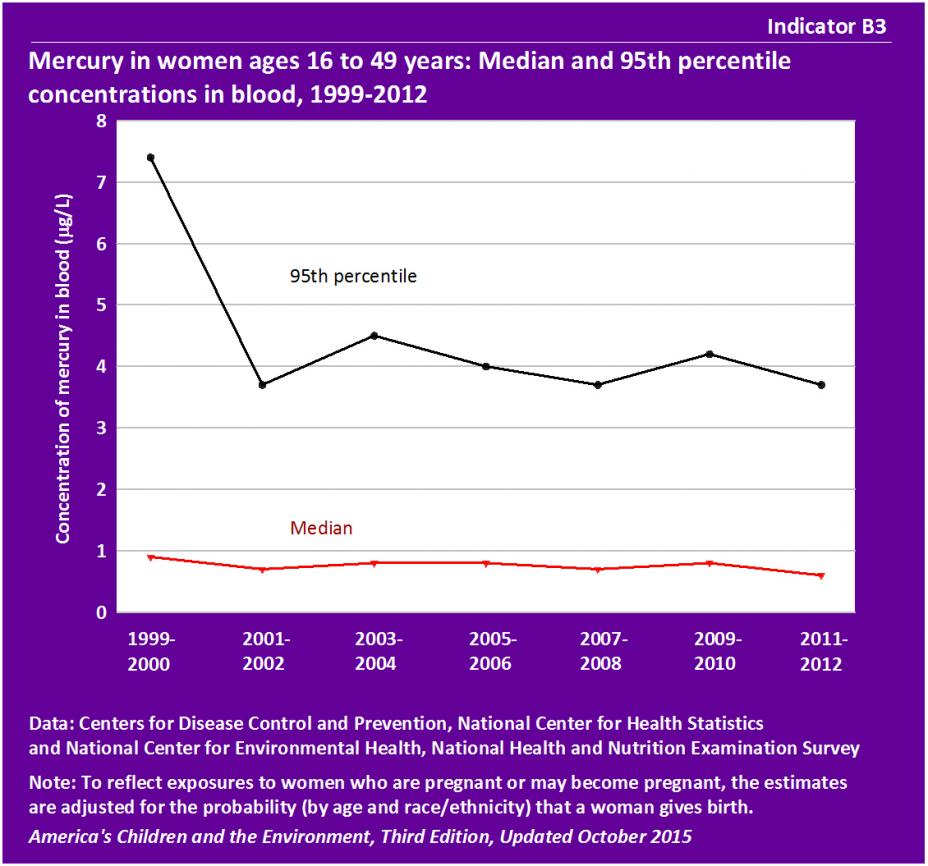
- The median concentration of total mercury in the blood of women ages 16 to 49 years has shown little change between 1999–2000 and 2011–2012, and was 0.6 µg/L in 2011–2012.
- Among women in the 95th percentile of exposure, the concentration of total mercury in blood decreased from 7.4 µg/L in 1999–2000 to 3.7 µg/L in 2001-2002. From 2001–2002 to 2011–2012, the 95th percentile of total blood mercury remained between 3.7 and 4.5 µg/L.
- The decrease in the 95th percentile levels of blood mercury between 1999–2000 and 2001–2002 was statistically significant. From 2001-2002 to 2011-2012 there was no statistically significant change.
- In 1999–2000, the 95th percentile total mercury level was 8 times the median level. For the remaining years, the 95th percentile total mercury levels were about 5 times the median levels.
- For the years 2009–2012, women of “All Other Races/Ethnicities” had median blood mercury levels of 1.1 µg/L, compared with median mercury levels for the remaining race/ethnicity groups of 0.6 µg/L for White non-Hispanic and Mexican-American women and 0.8 µg/L for Black non-Hispanic.
- (See Table B3a.)
- The median blood mercury level in Black non-Hispanic women was statistically significantly different from the median levels for each of the remaining race/ethnicity groups. No other race/ethnicity differences were statistically significantly different.
- Among women in the 95th percentile of exposure, differences in total mercury in blood were observed across race/ethnicity groups. For the years 2009–2012, White non-Hispanic women had a blood mercury level of 3.6 µg/L, Black non-Hispanics had 3.3 µg/L, Mexican-American women had 1.9 µg/L, and women in the ”All Other Races/Ethnicities” group had 5.8 µg/L.
- (See Table B3b .)
- The differences between race/ethnicity groups were statistically significant after accounting for differences by income level and age.
- Among women in the 95th percentile of exposure, women living at or above the poverty level had higher blood levels of total mercury (4.0 µg/L) compared with women living below poverty level (2.9 µg/L), a difference that was statistically significant. (See Table B3b.)
- The median and 95th percentile values for women of child-bearing age were about 3 to 4 times those of children ages 1 to 5 years. (See Table B3 and Table B3c .)
- Among children ages 1 to 5 years in the 95th percentile of exposure, the concentration of total mercury in blood showed a decreasing trend from 2.3 µg/L in 1999–2000 to 1.0 µg/L in 2011–2012. The median blood mercury level for children ages 1 to 5 years stayed relatively constant for the same time period . (See Table B3c.)
- The decreasing trend in 95th percentile blood mercury levels in children was statistically significant.
- Among children ages 1 to 17 years, median and 95th percentile blood mercury levels generally increased with age in 2009–2012, with higher blood mercury levels among children ages 6 years and older. Children ages 16 to 17 years had a median level of mercury in blood of 0.4 µg/L and a 95th percentile of 2.8 µg/L. (See Table B3d.)
- The differences by age group were statistically significant at both the median and the 95th percentile.
About the Mercury Indicator
Indicator B3 presents information about mercury levels measured in women. The data are from a national survey that collects blood specimens from a representative sample of the population every two years, and then measures the concentration of mercury in the blood. These indicators focus on women of child-bearing age because of concern for potential adverse effects in children born to women who have been exposed to mercury.
- Indicator B3 presents concentrations of mercury in blood of women ages 16 to 49 years from 1999-2012.
Mercury is a metal that is liquid at room temperature. There are three major forms of mercury. Non-elemental forms of inorganic mercury are found in batteries, some disinfectants, and some health products and creams. Elemental mercury is found in thermometers, fluorescent bulbs, dental amalgam fillings, switches in certain automobiles (used for convenience lighting in hoods and trunks, mostly in vehicles manufactured prior to 2003), and other sources. Organic mercury occurs predominantly in the form of methylmercury which may form when mercury is deposited into water systems (such as oceans, rivers, and lakes) and converted into methylmercury by bacteria and other microorganisms.
Methylmercury is of particular concern because it may bioaccumulate up the aquatic food web. Consuming fish is the main way that people are exposed to methylmercury. Each person's exposure depends on the amount of methylmercury in the fish that they eat and how often they eat fish. These exposure levels are of particular importance for women of child-bearing age because of the potential for prenatal exposure: methylmercury easily crosses the placenta and blood-brain barrier. As such, the prenatal period is considered the most sensitive period of exposure.
EPA has determined that methylmercury is known to have neurotoxic and developmental effects in humans. However, although ingestion of methylmercury in fish may be harmful, other compounds naturally present in many fish (such as high quality protein and other essential nutrients) are beneficial. EPA and the Food and Drug Administration (FDA) have issued a fish consumption advisory for young children and pregnant and breastfeeding women. The advisory encourages consumption of up to 12 ounces per week of a variety of fish and shellfish that are lower in mercury, and avoiding consumption of fish species that contain high levels of mercury.
Indicator B3 presents mercury levels measured in blood of women from the National Health and Nutrition Examination Survey (NHANES).
More information about mercury and Indicator B3 is provided in the updated Mercury section of America's Children and the Environment, Third Edition.
Related Links
Agency for Toxic Substances and Disease Registry (ATSDR): Mercury and Your Health
Centers for Disease Control and Prevention (CDC): Thimerosal
U.S. EPA: Fish Consumption Advisories
U.S. EPA: Methylmercury (MeHg) (CASRN 22967-92-6)
U.S EPA: What You Need to Know about Mercury in Fish and Shellfish
Summary of Methods - Mercury
The National Center for Health Statistics, a division of the Centers for Disease Control and Prevention, conducts the National Health and Nutrition Examination Surveys (NHANES), a series of U.S. national surveys of the health and nutrition status of the noninstitutionalized civilian population. Interviews and physical examinations are conducted with approximately 10,000 people in each two-year survey cycle. The survey measures mercury levels in blood samples collected from NHANES participants.
Indicator B3 uses the NHANES data to present median and 95th percentile concentrations of mercury measured in blood of women ages 16-49 years. The concentration of total mercury in blood is a marker of exposure to methylmercury in populations where fish consumption is the predominant source of mercury exposure.
Detailed Methods for Indicator B3
Metadata for National Health and Nutrition Examination Surveys (NHANES)