EPA Science Matters Newsletter: Volume 3, Number 3
Published August / September 2012
About this Issue
- 40 Years of Cleaning Up Our Water—It All Starts with Science
A note from Dr. Suzanne van Drunick, the National Program Director for EPA's Safe and Sustainable Water Resources research program.
Who wouldn't want to arrive at their 40th birthday healthier and in better shape than they were in their younger years? If the Clean Water Act could throw a party, it would have a lot to celebrate.
Forty years ago, the dire state of the nation's water resources was a national concern. The assaults were direct and numerous: untreated sewage, industrial and toxic discharges, contaminated runoff, and widespread destruction of wetlands.
For many, the symbol of that decay came in June of 1969, when something perhaps as simple as a wayward spark from a passing train ignited a mass of oil-soaked debris floating on the surface of the contaminated Cuyahoga River—sending thick, billowing black clouds of smoke into the air. A river on fire.
But then things started to change. The newly established U.S. Environmental Protection Agency was given clear direction "to restore and maintain the chemical, physical, and biological integrity of the Nation's waters" through major revisions to the Federal Water Pollution Control Act, better known as the Clean Water Act (CWA).
In the 40 years since, much of the nation's waters have become significantly cleaner and safer.
How did that success story unfold? It all started with science. EPA researchers and their partners provided the strong, scientific foundation that watershed and land managers, water system operators, state, local and tribal governments, and others needed to take action.
But despite significant and lasting advances, "21st century challenges" have emerged that today threaten to stall and in some cases reverse that progress. Just one example: stretched to serve an increasing population, many of our wastewater and drinking water systems suffer from inadequate, outdated or neglected infrastructure—leading to the loss of trillions of gallons of water each year at a cost of more than $2.5 billion.
And once again, EPA scientists and engineers are poised to meet the challenges.
The Agency's Safe and Sustainable Water Research program—the focus of this special issue of EPA's Science Matters—is designed to provide the innovative science and engineering solutions needed for protecting the nation's water resources today, while setting the stage for a more sustainable future. It's a fitting "birthday present" for an environmental and human health success story 40-years in the making.
Please enjoy this issue of EPA's Science Matters to learn more.
-Dr. Suzanne van Drunick, National Program Director, Safe and Sustainable Water Resources Research Program
In EPA's Office of Research and Development, Dr. Suzanne van Drunick is the National Program Director for the Safe and Sustainable Water Resources (SSWR) research program. By training, Suzanne is an environmental toxicologist with human health, ecosystem and science policy experience. She directs EPA research on wide-ranging water issues, from protecting water quality to the management of the nation's water infrastructure.
GEMS: Great Environmental Moments in Science
- Keeping Beaches Safe… with Statistics!
EPA researchers and partners are creating tools to help beach managers protect public health

For countless Americans, summertime is beach time: millions flock to the nation's coastal and inland beaches during the hot months of June, July, and August to enjoy sun, sand, and surf.
Beaches, however, are parts of complex ecosystems, and conditions in these ecosystems can sometimes lead to hazardous concentrations of certain kinds of bacteria. Typically found in sewage, these bacteria can multiply in the water and pose health threats to swimmers.
That's why beach managers are careful to monitor water quality at their beaches and issue swim advisories or close beaches in the case of dangerous bacterial contamination. The problem is that water sampling and analysis can take over 24 hours, meaning an existing contamination might go undetected for that long.
Working with collaborators in the U.S. Geological Survey (USGS), the National Oceanic and Atmospheric Administration (NOAA), state and local governments, and academia, EPA researchers have come up with a way to solve this problem: Instead of testing water to find indicators of bacterial contamination after the fact, create models that can predict contamination in real-time or even before the contamination occurs.The solution is a software suite called Virtual Beach. EPA scientists released the latest version of the program in March 2012.
"Virtual Beach allows users to develop custom models for their unique beach, which can be used to predict when levels of indicator bacteria in water will signal potentially dangerous contamination," explained Mike Cyterski, an EPA scientist who has worked on the development of the program. Beach managers can easily map their beach using an intuitive graphical interface, and import measurement data on wave height, precipitation, and other factors into the program.
By looking at data on the local watershed, Virtual Beach's models can find correlations between certain weather and water conditions and bacterial outbreaks, giving beach managers advanced warning of the kinds of contamination events that lead to swim advisories and beach closures.
"It's a real step forward in routine water quality monitoring," said Adam Mednick, a research scientist with the Wisconsin Department of Natural Resources, who has worked with EPA's scientists in testing and developing Virtual Beach for the last three years.
"Virtual Beach really improves ease of use," said Mednick. "The method of using predictive models for water quality has existed for a while, but this has made the process of developing the models much more efficient."
Virtual Beach has been successfully tested and used at beaches across the Great Lakes region, from Minnesota to Ontario. Researchers have also used it to successfully predict bacteria levels at marine beaches in Rhode Island, Mississippi, Alabama, Florida, South Carolina, and Puerto Rico.
EPA scientists are working on the next version of Virtual Beach, which will include more statistical methods for data-crunching, as well as a way for users to automatically retrieve data available online from institutions such as NOAA, USGS, and EPA.Learn More
- Into the Dead Zone
EPA researchers are creating a state-of-the-art three-dimensional model of the Gulf of Mexico's dead zone.
Every summer a massive area of oxygen-starved water (up to 20,000 square kilometers or 7,772 sq. mi., roughly the size of New Jersey) forms across the bottom of the Gulf of Mexico, adjacent to the mouth of the Mississippi River, killing bottom-dwelling marine life below and chasing some creatures farther out to sea.
This dead zone of hypoxic water is the result of an overload of nutrients—from fertilizers and storm runoff to untreated sewage and atmospheric nitrogen—being flushed down the Mississippi and into the Gulf. The nutrients fuel an explosion of plankton in the warm surface water, which then die and are consumed by bacteria below, robbing the bottom waters of oxygen.
The biggest casualties of the dead zone are sedentary animals such as shellfish and worms that live on the bottom. Other fish, such as croaker and menhaden, have been victims of massive fish kills as a result of hypoxia.
This phenomenon has been well-documented by scientists for decades, but now EPA researchers are putting together a state-of-the-art three-dimensional computer model of hypoxia to better predict where it will occur each year, and perhaps suggest ways to reduce its negative effects.
"The goal is to reduce the dead zone several-fold," said John Lehrter, research ecologist at the EPA's lab in Gulf Breeze, Fla. "We want to know to what degree do we need to reduce nutrients from the Mississippi River basin. The model and field observations are about describing the mechanisms - now we are putting it into this spatial context. With the model results, we can go back to decision-makers and show them what degree of nutrient reduction is required. It needs to be pretty specific and robust in its scientific realism."
Lehrter and his colleagues throughout EPA developed the model in conjunction with physical oceanographers at the U.S. Naval Research Laboratory in Stennis, Miss., who provided data about the swirling currents where the Mississippi River meets the Gulf of Mexico.
Lehrter said that hypoxia is determined by vertical separation, or stratification of the water, which occurs during the spring and summer as a layer of less-dense freshwater originating from the Mississippi River spreads out across the more-dense Gulf water.
"Once you have stratification, the trigger for hypoxia is excess organic matter that sinks down to the bottom. The next question is how it gets consumed by microbes and how much oxygen is drawn down in the process," Lehrter said.
Previous computer models of dissolved oxygen content and hypoxia have not taken into account the changing physical characteristics such as ocean currents, winds, and temperatures that can affect the development of hypoxia. As a result, the new model is more dynamic and more complex—so complex that the model has to be run on EPA's super-computer at Research Triangle Park, North Carolina.
Hypoxic zones have been found in 400 locations across the world along shallow coastal waters. The Louisiana/Texas dead zone is the second largest in the world behind the Baltic Sea dead zone.
As coastal areas become more crowded with people, these hypoxic areas are both expanding and getting worse. Still, Lehrter explained ecological impacts are not well understood. "We know from laboratory experiments that hypoxia is not a good thing, but we don't know in an open system like the Gulf of Mexico, whether mobile organisms could just escape laterally or move up in the water-column. Population level impacts are still an open question, and this is an area of very active research by community and fishery biologists."
Jacques Oliver, a biologist in the EPA's Office of Water in Washington, DC said the new model will help managers better predict how and when hypoxic conditions form. "It's important to understand what the drivers of hypoxia are and learn how to better manage those drivers."
Because of the potential economic effects of limiting nutrients from human activity, Oliver says it is vital to make sure the model is accurate before deploying it.
"Being able to use a water quality model for management purposes is really important. The science has to be first-rate. It has to be peer reviewed. That's what Lehrter's group is focusing on," Oliver explained.
Lehrter says the hypoxia model is being tested this year and will be ready to churn out decision-making products by 2013. Those products will help environmental managers make decisions about how to control the nutrient flows upstream that cause this problem in the first place.
Learn More
- Beneath the Surface
Glider surfs underneath the ocean, delivering new data about coastal waters
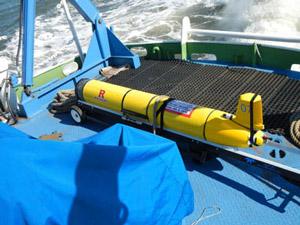
When seas are rough, gathering coastal water quality data can be a dangerous task for scientists onboard a ship. A collaborative team of researchers has a solution to minimize the risk: a robotic vehicle that will go beneath the surface, efficiently and safely capturing data about coastal water quality.
The robotic vehicle, known as an autonomous underwater vehicle (AUV), even allowed EPA to take ocean samples beneath Hurricane Irene, one of the few times an AUV was able to capture data during such a powerful storm.
"It was gathering data as Hurricane Irene was going over it," said EPA Environmental Scientist, Darvene Adams. "We were able to see how the water column reacts to the storm and how the water gets re-oxygenated by the hurricane. The whole study helps us understand the health of the ocean waters."
This particular AUV, called the "Slocum glider" –which resembles a six foot-long yellow torpedo– made its second summer deployment thanks to a collaborative effort between New Jersey's Department of Environmental Protection, Rutgers University, EPA Region 2 Office (serving New Jersey, New York, the U.S. Virgin Islands and eight Tribal Nations) and the Agency's Office of Research and Development.
Within three miles of shore, the Slocum glider maneuvered more than 185 miles along the New Jersey coastline collecting temperature, salinity, and dissolved oxygen readings. The purpose of the experiment was to check the health of the State's coastal zone during the peak of summer, a time of year when warm surface waters form what scientists call a "thermocline" – a transitional, mixed layer of water separating the warmer surface waters from the colder layers below. Under certain conditions, this layering of the water column can lead to poor water quality and can be harmful to humans and aquatic life.
"We are using the glider as reconnaissance," said Josh Kohut, principal investigator on the project and a physical oceanographer at Rutgers. "It's going out and monitoring dissolved oxygen along the coast during the peak beach season of the summer and relaying back where it's high and where it's low. That data can guide decisions that are being made at the state offices and regional offices of the EPA – whether a response is needed, and how it might be carried out."
"With some modifications, the glider was able to operate in shallow waters at a depth of 25 feet, much shallower than most gliders, which need at least 100 to 1,000 feet to gather data," Kohut said.
Instead of using a propeller, the Slocum glider moves forward by using its fins to steer the craft at an angle like flaps on an airplane wing, riding density gradients in the water up and down. The glider surfaces every two hours to take GPS readings and to send the scientific data back to shore using a satellite telephone connection.
Researchers say the Slocum glider goes where ships and scientists can't.
"There's no way to obtain these data otherwise," said Michael Borst, a chemical engineer at EPA. "The alternatives are to moor at many stations off the coast, or people can run out in boats to make measurements. This glider technology efficiently and economically merges these two techniques."Learn More
- Why Study Green Infrastructure?
EPA scientists and engineers are exploring how to tap green, effective, and low-cost methods to improve stormwater management
Flooding, raw sewage overflows, and nitrogen impairment are all real concerns for urban water systems across the United States. EPA researchers strive every day to understand the causes of these problems and to identify and share solutions.
One focus of water research is green infrastructure—environmentally-friendly techniques to reduce urban water problems and health risks.
Green infrastructure can take many forms, from small-scale rain barrels and rain gardens to large-scale cisterns and streams. Ultimately, all green infrastructure either retains excess water runoff or redirects the runoff into the ground before it can enter sewer systems where it can cause flooding or overflow into nearby water resources. By diverting water into the ground, plants and soil will naturally filter the water and keep it out of the sewers.
Often, green infrastructure measures are less costly than improving traditional pipe systems, and they also have the potential to provide additional benefits such as community revitalization and increased property value due to green spaces.
Although green infrastructure offers a variety of promising methods city managers can use to address their urban water issues, the effectiveness or maintenance requirements of these techniques has yet to be extensively researched or documented.
This is where EPA researchers are taking the reins. With research ranging from soil analysis to best placement modeling, Agency researchers are working to inform city managers and decision-makers on the science of green infrastructure practices.Read more about green infrastructure in this issue of Science Matters:
- Stormwater Calculator to Manage Rainfall Runoff
- Helping Cities Benefit from Green Infrastructure
- Showing Buried Streams the Daylight
Take a look at the video below of EPA scientists managing sewer overflows with green infrastructure.
Learn More
- Stormwater Calculator to Manage Rainfall Runoff
A new tool developed by EPA allows planners and property owners to assess how green infrastructure can be used to reduce rainwater runoff from development sites
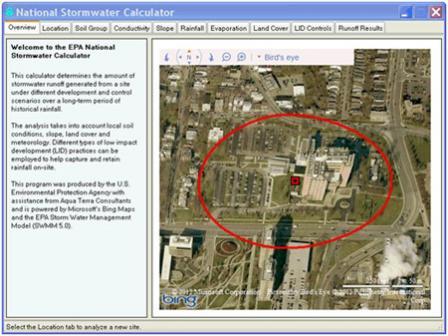 A screen shot of the Stormwater Calculator
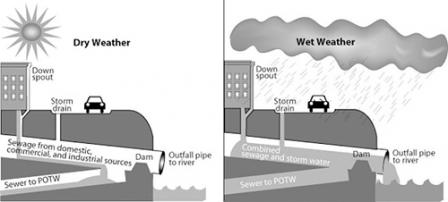
How is a parking lot like a rain garden? Well, the answer is: it’s not. During heavy rains, a parking lot floods streets and sewers while a rain garden soaks it in--reducing the amount of water entering the sewage system. How about planting a rain garden inside a parking lot? Perhaps that will help curb stormwater runoff.
In Summer 2013, EPA released a new tool called the National Stormwater Calculator (SWC) to help city planners, developers, and property owners confront these types of scenarios. The tool will help decision-makers balance land development decisions with green infrastructure practices--incorporating features such rain gardens, rain barrels, cisterns and natural areas that absorb rainwater-- to prevent problems associated with urban stormwater runoff.
Urban stormwater is a major source of impairment for rivers, lakes, coastal shorelines, and other water resources in the Nation. It is also responsible for flooding, combined sewer overflows which route both sewage and stormwater into common networks of pipes and tend to overflow during heavy rainfall, and reduced groundwater recharge. Incorporating green infrastructure into new development is one way to combat these stormwater issues.
The easy-to-use SWC will estimate the annual amount and frequency of stormwater runoff from a specific site based on local soil conditions, land cover, and historical rainfall records. Users can input any location within the U.S. and select different development and green infrastructure scenarios to see how those changes affect runoff volumes from that location.
The calculator accesses several national databases to provide local soil and weather conditions for the chosen site. The user supplies information about the site’s land cover as well as what types of green infrastructure they would like to deploy. The latter refers to such low impact controls as rain gardens, cisterns, and porous pavement that retain rainfall on site until it eventually evaporates, infiltrates, or is otherwise consumed.
As an example of how the calculator might be used, consider a developer or municipality building a parking lot on what is currently vacant land. When the developer or municipality uses the Calculator for the location and adds a parking lot, they may find that runoff volumes greatly increase, perhaps even exceeding local ordinances. They may then decide to add green spaces and rain gardens to the lot or use porous pavement. Running this scenario through the Calculator may reveal that runoff volumes are reduced with those changes, meeting local standards.The calculator is phase I of the Stormwater Calculator and Climate Assessment Tool package announced in the President’s Climate Action Plan in June, 2013. An update to the Stormwater Calculator, which will include the ability to link to several future climate scenarios, will be released by the end of 2013. Climate projections indicate that heavy precipitation events are very likely to become more frequent as the climate changes.
Learn More
- Helping Cities Benefit from Green Infrastructure
EPA provides research and guidance on the incorporation of green infrastructure into Omaha's combined sewer overflow control plan
 Combined sewer systems can lead to overflows during heavy rain.
In collaboration with the City of Omaha and the Nebraska Department of Environmental Quality (NDEQ), EPA scientists are analyzing soils and preparing monitoring equipment to reduce the incidence of combined sewer overflows (CSOs) using green infrastructure.
As the name implies, combined sewer systems route both sewage and stormwater into common networks of pipes and tend to overflow during heavy rainfall. Like hundreds of U.S. communities, Omaha is working to reduce the occurrences of CSOs, which contaminate water resources and threaten human and environmental health.
EPA is providing guidance on how the city and NDEQ can incorporate green infrastructure--features such rain gardens, rain barrels, cisterns and natural areas that absorb or reduce runoff--into their CSO control plan. Both the city and state asked EPA scientists to assist them with at least 14 sites under consideration for green infrastructure installations.
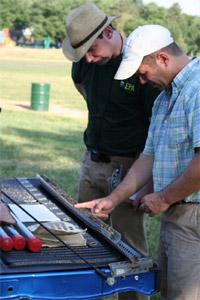 EPA's Bill Shuster and soil scientist Steve Dadio examine a soil core.
The Minnelusa watershed in Omaha offers a likely location for using green infrastructure, such as rain gardens, that would capture stormwater runoff from sidewalks and soak it up before it reaches the combined sewer system. In July, a team of EPA researchers, led by Dr. Bill Shuster, collected soil samples from each potential green installation location. By analyzing sample cores of both topsoil and subsoil, Shuster’s team can determine the ability of those sites to effectively capture stormwater.
“All soils move water, but some are better than others,” explained Shuster. “We need to know how Omaha soils move water before we can plan how to put stormwater into those soils.”
Once the city and state agree on the types and locations of green infrastructure installations, EPA will work with the local USGS to establish monitoring sites around these installations. Monitoring will begin before the green infrastructure is installed and will continue after installation to determine how well it performs with respect to water capture and infiltration.
“The idea is to have data that demonstrates how effective the green infrastructure was at capturing rainfall locally,” explained Dr. Alice Gilliland, an EPA scientist involved with green infrastructure research planning.
Through this collaboration with community and state partners, the impact of this EPA research will extend far beyond Omaha.
“Having this kind of community involvement can help the individual community,” said Gilliland. “But it also helps develop a protocol to show other communities how they could approach the same issue. There are many communities dealing with this CSO problem.”
Learn More
- Showing Buried Streams the Daylight
Researchers compare the effectiveness of buried streams versus open-air streams for removing harmful nitrogen from water systems
Dark, wet and ever-flowing, but rarely seen. If you live in a city, they are all around you, but you would never even know it. They are buried streams—waterways that once flowed over land but were routed into underground pipes to make way for urban development.
New EPA research suggests that these buried streams may contribute to the degradation of water quality in this country. Consequently, scientists offer a simple solution: un-bury the streams.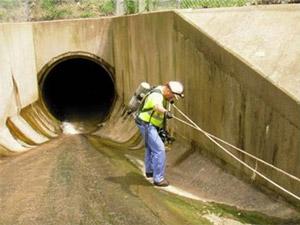 "It's pretty creepy," says ecologist Dr. Paul Mayer about visiting buried streams. "There's actually a high danger factor just in moving around. Nobody has ever looked at buried streams and it's partly because it's really hard to do the research." EPA Health and Safety personnel inspected the air quality in buried stream pipes before researchers ventured down to collect data.
Researchers hypothesized that buried streams are less effective at removing nitrogen than streams above ground that are open to daylight and air. Excess nitrogen is a major contributor to nutrient pollution, which can spark algae blooms and other problems for streams and other waterways and can be unhealthy to people if it taints drinking water sources.
To test their theory that buried streams may be contributing to the overabundance of nitrogen in U.S. waters, EPA researchers selected three streams in Baltimore and three in Cincinnati that had both above and underground stream sections. By monitoring segments of each over the course of a year, researchers will be able to compare nitrogen concentrations in daylighted streams to those in buried streams.
“So far what we found is that the daylighted streams are far more effective than buried streams at processing nitrogen, up to 23 times more effective,” says ecologist Dr. Paul Mayer explaining the preliminary results.Reducing Nitrogen and Other Benefits
The results of the research may reveal a likely solution for urban city managers looking for a way to improve their water quality. Buried streams under vacant lots or city parks could be dug up and restored to their natural above-ground state—a process called daylighting—as a method for removing nitrogen from the water system. Successful daylighting projects have already been completed in cities around the world including Seoul, London, and Philadelphia.
Excess nitrogen is a major impairment to the nation’s waters. Nitrogen from agricultural, industrial, and urban sources enters inland waterways in abundance. Since streams and rivers carry their nutrient load downstream, coastal environments like the Gulf of Mexico suffer the consequences. The Gulf’s “Dead Zone” has been so affected by nitrogen overload that aquatic life cannot survive.
“Basically, if you care about the health of our coastal waters, if you care about the robustness of the fisheries and the economic activities associated with coastal waters, then nitrogen is an issue you should be concerned about,” remarks Dr. Jake Beaulieu, the EPA scientist leading the research effort. “We believe that stream daylighting should be viewed as one of the tools we have to try to address this issue.”
Why does daylighting help nitrogen removal? Bacteria living in the sediments of above ground streams and rivers convert nitrogen in the water (in the form of nitrate) into nitrogen gas, a benign form of nitrogen that leaves the water and enters the atmosphere. However, buried stream environments do not support many of these bacteria so less nitrogen is removed from buried waters. The natural process of nitrogen removal—called denitrification—inspired scientists to search for ways to harness it to improve water quality.
Mayer explains, “If we find that daylighting a stream and exposing it to the world can be very effective at removing nitrogen, then this could be a best management practice for cities to pursue in lieu of trying to redesign their sewer infrastructure or trying to implement something that is far more expensive.”Daylighting streams may also provide cities with a novel approach for dealing with sewer overflows. By uncovering buried streams, water would flow along the surface instead of being routed through city pipes. For cities facing challenges to both improve water quality and decrease sewer overflows, a daylighting stream approach may offer a dual solution.
Another potential advantage of stream daylighting is neighborhood revitalization, particularly in run-down and currently vacant areas.
“It may be a case where that simple act of creating this daylighted stream can create a center for commercial or residential development,” says Mayer. “Neighborhoods may be rejuvenated in a way that brings people back to those neighborhoods and kind of supercharges that part of the city.”
Study results are expected by the end of 2012. The outcomes of this project and further research will be used to inform a new modeling tool for urban managers. This tool will help identify places within a city where daylighting streams would be most effective.Learn More
- Public Database Helps Users Provide Clean Drinking Water
EPA's Drinking Water Treatability Database provides a one-stop shop for information on contaminants and treatment options.
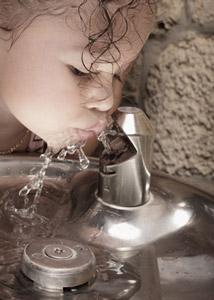
“It’s potentially the largest single compilation of referenced drinking water treatment data in one place,” remarked EPA’s Richard Miltner, an environmental engineer and the database administrator of the agency’s recently updated Drinking Water Treatability Database (TDB).
The TDB is a “one-stop shop” type of tool to help anyone looking for information on water contaminants and water treatment techniques. Drinking water managers, system operators, engineers, and regulators can use the TDB for on-the-job decisions about contamination control and treatment. Researchers, environmental groups, and academics may also use the TDB to enhance understanding and direct future research of drinking water contaminants and their treatment processes.
Before the TDB was developed, finding drinking water contaminant information and treatment processes required searches through multiple scientific references, even for just a single contaminant. EPA researchers have been pulling data from a number of sources, including peer-reviewed scientific literature, conference proceedings, textbooks, and web sites, into one user-friendly database.
The database provides important information for people tasked with keeping the nation’s drinking water clean and safe. It includes an overview of each contaminant, a list of physical, chemical, and biological properties, summaries of the effectiveness of various treatment processes, and references.Currently, the TDB contains information on 60 contaminants, including those currently regulated in drinking water, those on the Contaminant Candidate List (CCL) for consideration for regulation, and emerging contaminants of concern that may still be unregulated.
The TDB also describes 34 treatment processes, including processes most commonly used by utilities today and processes less common but known to be effective. Users can match their contaminants of concern with treatment processes that fit their specific situation.
This database is a public resource and was designed based on users’ needs. “We wanted to have something the public could use to be able to get information on specific contaminants in the water,” explains Miltner.
As the only database of its kind, the TDB is an extremely valuable source for drinking water contaminant information. With it, users can make better informed decisions about what drinking water treatment processes works best for a specific contaminant. The result? Safer drinking water.Learn More
- New Ballast Water Protocols Designed to Stop Invasive Species
EPA Partners with Coast Guard to Develop Ship Treatment System Protocols
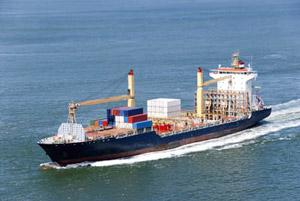
Marine organisms have been hitchhiking on ocean-going ships for probably as long as there has been long distance shipping. One significant source: the ballast water that vessels pump in and out of their hulls to keep stable as they unload cargo or maneuver at sea.
Unintentional releases of non-native invasive species have created ecological havoc in waterways throughout the world. For example, the zebra mussel (Dreissena polymorpha), native to eastern Europe, was first discovered in the Great Lakes nearly 25 years ago, and the comb jellyfish (Mnemiopsis leidyi), native to North American waters, has invaded the Mediterranean Sea.
"The problem is that when ships are pulling in ballast water, all of the organisms, including microscopic zooplankton and phytoplankton, in that area also get pulled into the ballast tank," says EPA Environmental Protection Specialist Ray Frederick.
"Most of these organisms don't survive the voyage, but some do. When these more robust organisms are discharged into new environments, they often out-compete native species for food and shelter, and their populations explode resulting in widespread ecological imbalance. The zebra mussel has become the poster child for this problem."
To comply with new regulations from the U.S. Coast Guard (USCG) and proposed rules from the International Maritime Organization, many ships will elect to treat ballast water with manufactured devices that use a variety of disinfection technologies such as ozonation, UV filtration, electrochlorination, or various chemicals to kill micro-organisms.
Until recently, however, regulators couldn't be sure if the treatment systems designed for shipboard installations worked well enough to comply with USCG's regulations. To address this issue, the EPA and U.S. Coast Guard joined forces to develop new performance verification protocols that ensure the devices are effective at destroying organisms that could pose environmental and economic risks to the ports they visit.
"Together with the Coast Guard, the EPA has developed a standardized process to evaluate ballast water treatment systems that is technically sound and with appropriate levels of quality assurance. The resulting test reports are intended to provide highly credible and comparable data that is both transparent and available to anyone," Frederick said.
The Coast Guard has been working with EPA and a participating stakeholder group for the past 10 years on protocols for the treatment systems under the Environmental Technology Verification program, according to Dr. Richard Everett of the USCG's Environmental Standards Division.
Using a commercial ballast water treatment system, engineers and scientists at the Naval Research Laboratory (NRL) in Key West, Florida, validated the test protocol developed by EPA and the USCG. Researchers at NRL are also working on methods to test ballast water discharges for invasive organisms. Some of these methods are similar to pool test kits and will help Coast Guard inspectors and ship operators know if the treatment systems are functioning properly and if the ballast water is clean enough for discharge.
Everett says the economic and environmental impacts from species moved by ballast water should decline as a result of the new protocols, but the impacts may not be immediately evident. Everett says, "It has been well documented that many invasions are not recognized as having occurred for some time, often many years."DNA Barcoding
So you have a sample of water from a ship’s ballast water, a pond, or a stream ecosystem. How do you find out what’s been in it?

The traditional method is the most obvious: comb through samples as thoroughly as possible in the lab, and identify each specimen you find. Needless to say, this is time consuming, labor-intensive, and slow — with surveys sometimes taking from six months to a year to complete.
Now, there’s a way to sidestep quantifying species in water samples by simple visual inspection. EPA scientists are using a technique called “DNA barcoding” to rapidly and accurately identify species in water samples.
Animals such as snails, worms, and insects leave genetic footprints behind in water they inhabit, and DNA barcoding can identify these signs.
“DNA barcoding comes at a comparable cost to older collection methods,” said EPA scientist Erik Pilgrim, who is using the method to study the health of ecosystems. “But barcoding is faster, and you get richer information with more taxonomic resolution.”
Instead of simply finding and counting species (which sometimes are not visually distinct), DNA barcoding relies on identifying short, species-specific sequences of a standard gene. This allows scientists to use the method to differentiate between many more species in water samples than they can with traditional lab methods. Once sequences are analyzed, they can be compared to existing DNA barcode databases, giving scientists a far more comprehensive picture of organisms in the water.
“This is good for bioassessment,” Pilgrim explained. “You can use the identifications you make to say something about the overall health of an ecosystem.”
DNA barcoding may also provide a way to identify invasive species, such as the kinds sometimes introduced by ocean-going ships’ ballast water.
“Barcoding may be a way for us to get early warnings of invasive species,” said Pilgrim.
More information on EPA’s DNA Barcoding ResearchLearn More
- Small Businesses Keeping Our Water Clean and Protected
EPA’s Small Business Innovation Research Program supports innovative environmental technologies.

As the U.S. and global population continues to increase, the demand for clean water is growing dramatically. Innovation promises to protect our precious water resources while also stimulating job growth.
To drive innovation, EPA recently granted seven Small Business Innovation Research (SBIR) awards focused on the development of new technologies to keep our water clean. These awards were given in collaboration with the Water Technology Innovation Cluster (WTIC) in Cincinnati (see sidebar) and focus on sustainable approaches to water quality and supply.
The federal SBIR program provides resources to small businesses to develop new innovative technologies – creating new jobs and positively impacting our economy. So far, about 30% of SBIR companies generate sales figures that exceed the initial SBIR investment five times over.
Of the seven companies receiving SBIR awards related to water, three will develop new technologies to treat and protect drinking water, wastewater, and stormwater. The other four companies will develop tools to monitor drinking water and wastewater for contaminants.
The companies and their award-winning projects include T3 Scientific and SolarBee, Inc.:- T3 Scientific is creating a highly-efficient water purification system that will reduce energy use by over 90% as compared to conventional water purification processes--making the system operable using solar energy or waste heat produced by machines, electrical equipment, and industrial processes.
The technology will help keep drinking water safe when access to electricity is unavailable, such as in the aftermath of a big storm.
“The SBIR program fills an important void in the funding continuum to provide support for great innovations,” says Andy Tsai, director and chief technology officer at T3 Scientific.
- SolarBee, Inc. which developed a drinking water treatment technology for a group of chemicals called trihalomethanes (THM), a disinfection by-product regulated by EPA as part of its efforts to keep drinking water safe and clean.
To reduce levels of THM in drinking water, SolarBee is developing a water treatment prototype that combines traditional diffused aeration (DA) systems with SolarBee’s innovative solar power circulation (SPC) technology. SolarBee anticipates that their prototype will reduce THM levels by 50% and reduce power usage by 80%.
“The [SBIR] program enables EPA to help provide technological solutions for municipalities trying to comply with EPA regulations,” says Willard Tormaschy, vice president and operations manager at Solarbee, Inc.SBIR and WTIC also encourage collaboration between universities and small business researchers. For example, another SBIR awardee, Faraday Technology, Inc., is working with the University of Pittsburgh to create a compact, affordable, and easy-to-use monitoring system for detecting contaminants in water. Faraday Technology plans to make the sensor more affordable and simple to use than current technologies. This will make the system more broadly available, allowing small communities with limited resources to efficiently monitor their drinking water.
T3 Scientific, Faraday, and Solarbee’s projects are just three examples of the innovative work that will result from the seven small businesses receiving SBIR awards. The awardees will develop a number of technologies to address our increasingly complex environmental challenges, while also helping to spark job and economic growth in their communities.Learn More
- Strengthening Streams in California
The State of California employs EPA's causal assessment CADDIS tool to identify and treat problems in waterways
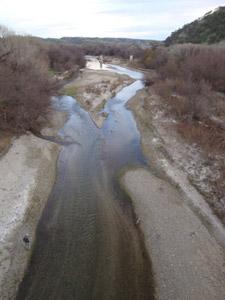 The Salinas River in California, one of three causal case studies in freshwater streams.
Thriving aquatic life--fish, insects, plants, algae and invertebrates--is a good indication that a stream or other watery ecosystem is healthy. On the other hand, aquatic life that is unhealthy or dying off is a strong signal that there is a problem. But beyond that initial diagnosis, deciphering the cause of the trouble can be a serious challenge. In such situations, scientists conduct a causal assessment to discover the cause of the problem and develop solutions to remedy it.
A causal assessment uses a variety of techniques to evaluate data and other information to identify probable culprits, much like a doctor conducts exams and tests to diagnose illnesses or injuries in a patient.
Over the last 15 years, EPA has honed its causal assessment process, an effort that culminated in the Causal Analysis/Diagnosis Decision Information System (CADDIS), a valuable tool that water managers and others from states and tribes rely on to identify problems in their local waterways. Named for caddisflies, an order of insects whose larvae live in flowing waters on the bottom of high quality streams, CADDIS provides a step-by-step framework to help conduct causal assessments, mainly in streams.
Recently, the State of California began using CADDIS as a way to find the causes of unhealthy streams and identify solutions. The EPA, the Southern California Coastal Water Research Project, the California Department of Fish and Game, and several stakeholder groups, have collaborated to conduct causal assessment case studies for three freshwater streams: the Santa Clara and San Diego Rivers, the Salinas River, and the Garcia River.
These three case studies capture the diversity of California's geography, land use characteristics, and stressors. Each examines evidence to identify the cause(s) of unhealthy aquatic life and provides recommendations for future causal assessment efforts.
The goal of the collaboration is to help California protect the health of state streams and, ultimately, the people who depend on them.Learn More
- Keeping an Eye on Wetlands
EPA researchers develop ways to study, assess, and report on the state of the nation's wetlands.
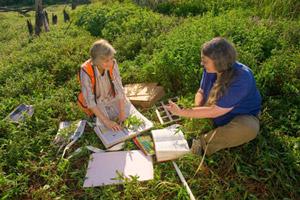 EPA wetland researchers Mary Kentula, Ph.D. and Teresa Magee collect vegetation samples in a wetland outside Corvallis, Oregon.
If you appreciate ducks and other waterfowl, fish, seafood, and natural flood control and water filtration, you are already a fan of wetlands. Defined by ecologists as those habitats where the degree of water saturation largely determines the make-up of the species living in the ecosystem and the types of soil found, wetlands provide many ecological, economic, and social benefits.
A few centuries ago, the continental United States had more than 220 million acres of wetlands. Today, less than half remain.
Reducing the loss of wetlands is one of EPA's goals in meeting its mission to protect human health and the environment. To that end, Agency scientists and their partners provide the critical data, analysis, and assessments used to monitor the status and trends of the Nation's wetlands.EPA scientists have been working since 2007 to advance the science behind wetland assessments through the National Wetland Condition Assessment (NWCA), which, when complete, will provide a comprehensive statistical survey of the quality of the Nation's wetlands.
"This is the first time a network of partners has been brought together to develop standardized, uniform assessment techniques that will lead to statistically-valid estimates of the ecological condition of wetlands on a national level," says EPA ecologist and wetlands expert Mary Kentula, Ph.D.
In the first phase, Kentula and her EPA colleagues worked to develop those techniques with partners from other federal agencies (including the U.S. Fish and Wildlife Service, USDA National Resource Conservation Service, National Park Service, U.S. Forest Service and NOAA's National Estuarine Research Reserve Program), states, Tribes, and others. The process was also designed to foster collaboration and help implement wetland monitoring programs that would benefit all the partners and support local decision makers.
That work was put into practice this past summer, when 55 field crews surveyed some 1,250 wetland sites across the contiguous U.S. and Alaska. The 33,000 or so samples the field crews collected are now being analyzed by different labs across the country, with completion expected in fall 2012.
Following peer review and a public comment period, EPA is scheduled to release a final wetlands assessment in December 2013.
When complete, NWCA will present a significant advancement in the understanding of wetland quality nationwide, providing resource managers and decision makers with critical information they need to better protect the function and integrity of the nation's wetlands for current and future generations.
Ultimately, the impact of that work will be evident by the presence of waterfowl, fish, seafood, natural flood control and water filtration, and other benefits of the nation's wetlands.Learn More
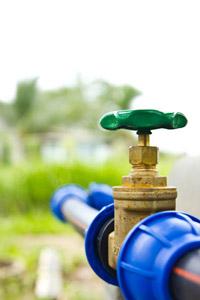
- Protecting Drinking Water from Re-contamination
EPA scientists advance understanding of how biofilms in a drinking water system can harbor harmful bacteria following decontamination.
Under the Bioterrorism Act of 2002 EPA's responsibilities were expanded to address protecting water infrastructure associated with terrorist attacks. EPA fulfills this responsibility by conducting research on ways to prevent, mitigate, and recover from terrorist threats and attacks on water systems.
Most utility managers know how to treat and decontaminate their community's water system in the event of a bioterrorist attack. However, according to researcher Dr. Gene Rice, "…even after a drinking water supply has been treated, harmful bacteria can still exist in the pipes by living in biofilms." Biofilms are a collection of organisms adhering to a surface, and over time, they can build up inside of water pipes.
To address this issue, EPA researchers recreate biofilms under controlled conditions, allowing them to explore ways to remove biofilms from pipes.
Using an instrument called a Biofilm Annular Reactor, researchers can explore the effectiveness of methods (i.e. flushing or chlorination) to remove biofilms from pipe walls. These simulations are repeated under different conditions because not all biofilms are the same. Pipe materials (such as cement mortar and iron), water composition, and other variables can all affect how biofilms may react to decontamination and treatment efforts.
By testing biofilms and various treatment processes under many conditions, water utility managers, emergency responders, and remediation personnel can prepare for and recover from potential attacks in communities nationwide. This research helps to ensure that the treatment processes following a bioterrorist attack are thorough enough to ensure that drinking water is safe for consumption.Learn More
- Planning Better for a Changing Climate
EPA researchers and partners develop assessment tools to help communities make better informed environmental decisions.
With temperatures skyrocketing across most of the country, this summer's drought is one for the record books. In late July, more than 80% of the United States was in drought – once considered a rare occurrence. Data show that the hot is getting hotter and when it rains, it pours. Extreme weather events like these can affect existing environmental issues such as water quality, quantity, and pollution. But how can we understand and predict ways that these types of changes might impact us?
EPA researchers and partners recently developed two assessment tools, the BASINS Climate Assessment Tool (BASINS-CAT) and the Water Erosion Prediction Project Climate Assessment Tool (WEPPCAT), to help local communities make better informed environmental decisions.
The BASINS-CAT and WEPPCAT tools allow users to create a wide range of climate change scenarios. These scenarios can then be used as inputs to two existing water simulation models called BASINS and WEPP. BASINS, an EPA model, supports assessments of watershed land-use change, pollutant discharges, and management practices on water quality. WEPP, created by the US Department of Agriculture, simulates soil erosion and sediment yield from agricultural areas.
By using BASINS-CAT and WEPPCAT as inputs to BASINS and WEPP, users can run different computer simulations to assess how streamflow or water quality in a specific watershed might change. The results will help us understand how water system characteristics such as streamflow, water quality, and soil erosion could be affected by changes in climate, land use, and management practices.
BASINS-CAT and WEPPCAT are important tools to decision makers, such as watershed managers, who can use the information to prioritize resources and make planning decisions as well as to reduce risks associated with climate change and extreme weather events.Learn More
- Tools to Assess Potential Water Contaminants
EPA researchers are developing high tech tools called "Dashboards" to help assess potential water contaminants.
There are tens of thousands of chemicals in the environment. Only a small fraction of these chemicals have been thoroughly evaluated for their impacts on human health and the environment.
To help prioritize chemicals for testing, EPA researchers and their partners are developing user-friendly online tools called Dashboards. These interactive web-based tools will make chemical information available and accessible to EPA's program offices and others who make policy and regulatory decisions related to chemicals.
Being designed hand-in-hand with stakeholders and partners, the Dashboards will provide accessible, user-friendly chemical exposure data, hazard data, decision rules, and predictive models.
The information will help decision makers prioritize chemicals that warrant further testing and will eventually help predict a chemical's potential to cause harm to human health and the environment.
EPA researchers are currently developing three Dashboards to provide information for those responsible for taking action to protect the nation's water resources. Because of the many hurdles faced in protecting our water, these three Dashboards work in different but important ways:- The Office of Water in the 21st Century (OW21) Dashboard will organize available contamination data to help identify chemicals for future drinking water contaminant lists (see Contaminant Candidate List sidebar). It will also help prioritize chemicals on existing lists and helps determine if any chemicals need additional testing.
- The Ubertool Dashboard combines different data sources and ecological models to help decision makers estimate the effects of chemicals on aquatic plants and animals.
- The Endocrine Disruption Screening Program in the 21st Century (EDSP21) Dashboard will support EPA’s Endocrine Disruption Screening Program by providing data on approximately 2,000 endocrine disrupting chemicals (EDCs) screened by EPA’s Toxicity Forecaster. EDCs are of particular concern to fish and other aquatic species, and the Dashboard will help prioritize them for testing.
EPA scientists and engineers are currently sharing Dashboards prototypes with EPA program offices for input and improvement. When complete, the Dashboards will efficiently and effectively enhance EPA’s assessment of potential water contaminants, leading to healthier water resources for everyone.
Learn More