Marine Water Quality
Summary
Declining
Marine dissolved oxygen is showing a long term decline in the waters of Puget Sound and in the deeper waters of Georgia Strait. Marine Water Condition Index scores also have been in general decline over the past ten years for many areas in Puget Sound.
Water quality is the foundation for all plants and animals that depend on the Salish Sea - from algae to fish to marine mammals. Water quality also affects people. It affects us directly when we go to the beach, fish, or dig clams, and indirectly as we enjoy the wildlife and scenery of the area.
This indicator summarizes trends in the amount of dissolved oxygen as a measure of the overall quality of the marine waters in the Salish Sea.
- What is hypoxia?
Hypoxia is the term scientists use to describe water conditions in which there is not enough oxygen to support aquatic life.
Hypoxia can occur naturally or as a consequence of human pollution. In the Salish Sea, hypoxia commonly occurs in mid- to late summer when temperature differences between the top of the water column and the bottom are greatest. This temperature difference restricts oxygen in surface water from naturally mixing with water near the bottom - which can lead to hypoxia.
The impact of seasonal hypoxia has dramatically increased over the past few decades due to human-caused eutrophication from fertilizer runoff and other nutrient sources including animal waste, failing septic systems and municipal and industrial wastewater discharges. Eutrophication is an increase in nutrients in the water that can lead to algal blooms. When the algae eventually die and sink to the bottom, they are consumed by bacteria and other organisms - a process which uses up oxygen.
Sustainable Perspective
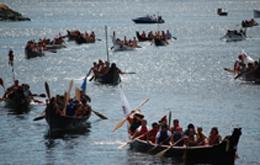
The Annual Canoe Journey is a traditional gathering of Coast Salish people who travel through the waterways of the Salish Sea. In 1989, Pacific Northwest tribes revived a tradition of bringing together their people to celebrate their connection to salmon, water and each other. Since then the Annual Canoe Journey expanded from a handful of canoes to include over a hundred tribes and First Nations.
In 2008, a partnership developed between the Salish Canoe Journey and the U.S. Geological Survey to examine coastal waters of the Salish Sea by blending Western science and Coast Salish culture to study water quality and its effects on the ecosystem. Journey participants agreed to equip their canoes with water quality monitoring instruments to measure sea surface temperature, salinity, pH, dissolved oxygen, and turbidity simultaneously every ten seconds across 1,300 kilometers (over 800 miles) of the Salish Sea.
What's happening?
When dissolved oxygen is low, it means there's less oxygen available in the water to support aquatic life. Scientists can tell that dissolved oxygen levels in the Salish Sea have naturally risen and fallen over the past 400 years. We don't know whether the current decline is human-caused or not, but we do know that it's making aquatic life more vulnerable to pollution and other impacts from people.
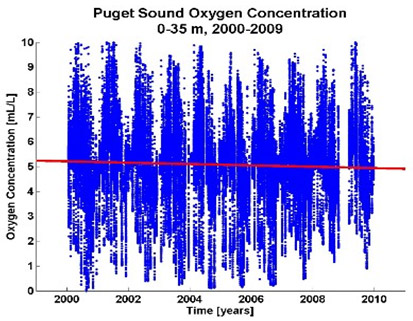
- Dissolved oxygen trends in Puget Sound
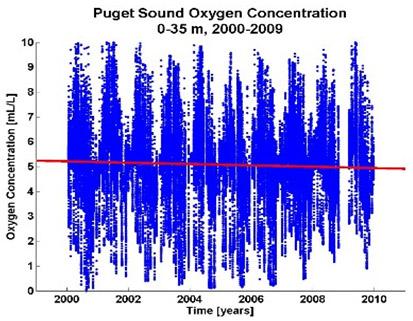
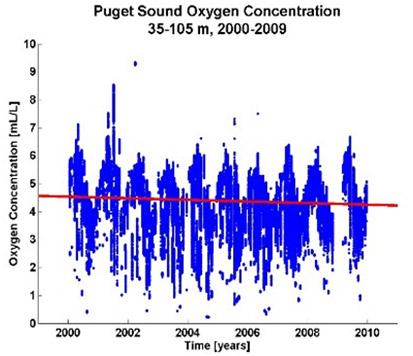
The two graphs below show dissolved oxygen data collected in Puget Sound between 2000 and 2009 at two depth intervals: 0-35 meters and 35-105 meters. At 0-35 meters deep, the dissolved oxygen levels vary more widely due to oxygen exchange with both the atmosphere and biological processes. At 35-105 meters deep, the dissolved oxygen levels are more stable.
The red line through each graph shows the approximate trend over time. The downward slope of these lines shows a negative trend in the oxygen concentration since 2000.
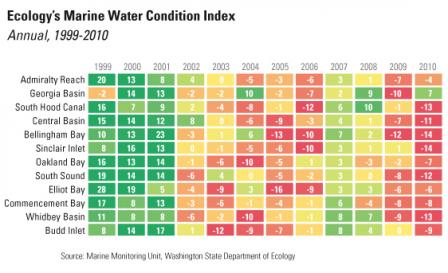
- Puget Sound Marine Water Condition Index
Scientists have developed a Marine Water Condition Index that summarizes 12 different water quality measurements into a single number ranging from -50 to +50. Numbers greater than zero on the index represent improving water quality, while numbers less than zero represent decreasing water quality. By following the index over time, we can see whether overall water quality is improving or getting worse.
The chart below shows Marine Water Quality Index values for Puget Sound from 1999 to 2010. Improving water quality is shown in green, while decreasing water quality is shown in orange and red (click on graph for larger image).
- Dissolved oxygen trends in Georgia Strait
The charts below show dissolved oxygen data collected in the Strait of Georgia between 2000 and 2009 at three depth ranges: 0-35 meters, 35-105 meters, and 105 meters to the sea bottom.
0-35 meters
The upward slope of the red line in the first chart reflects an increasing trend for dissolved oxygen in surface waters. This is opposite of what we found for surface waters (0-35m) in Puget Sound, which showed a decreasing trend.

35-105 meters
The downward slope of the red line in the first chart is consistent with the decreasing trend we found in Puget Sound at the same depth (35-105m).

105 meters to bottom
The downward slope of the red line in the first chart is consistent with the decreasing trend we found in Puget Sound in deeper waters.


Why is it important?
Fish, crabs, and other marine animals need oxygen to survive. As oxygen levels decrease, these animals respond by changing their behavior to maintain their oxygen intake, such as moving to areas with greater oxygen levels, feeding less, and swimming less. Fish living under reduced oxygen levels have shown less resistance to disease and lower reproduction rates. If oxygen levels get too low, fish and other animals may die - sometimes resulting in widespread "fish kills."
- Learn more about why it's important
Reduced growth, slowed development, deformities, and mortality (death) are among the most extreme impacts from low dissolved oxygen (hypoxia). An animal's mobility and its ability to regulate its respiration affects how much it will be impacted by low dissolved oxygen. Species that can not tolerate low oxygen will either die or move to other areas (if possible), while species that can tolerate these conditions will thrive - thus impacting the makeup of the biological community.
Low dissolved oxygen may also make marine animals more susceptible to impacts from toxic substances. This may be because low dissolved oxygen levels cause them to pass more water through their gills and increase the amount of pollution absorbed in their bodies.
Why is it happening?
Oxygen levels are generally highest in surface waters and areas where enough light can penetrate to allow photosynthesis to occur, which generates oxygen. Oxygen levels are lowest in areas where mixing of surface and deeper waters is restricted (such as deep channels), areas that get little sunlight, and areas that have an abundant supply of organic matter from natural and human-made sources (such as discharges from wastewater treatment plants and septic systems, and stormwater runoff.)
Oxygen levels are currently declining in oceans and coastal waters around the world in part due to climate change. Warmer surface water absorbs oxygen less easily, and restricts natural mixing with deeper, colder waters. Warmer water also encourages growth of phytoplankton which use up oxygen in deep water as they sink and are consumed by bacteria.
- Learn more about why it's happening
In many parts of the Salish Sea, low dissolved oxygen is due to natural causes.
Deep water is colder and less salty than surface water. This difference causes the natural mixing process to slow down, and less oxygen is carried from the surface to deeper areas. For example, the deep waters off the coast that enter the Salish Sea through the Strait of Juan de Fuca are naturally low in dissolved oxygen.
Also, the fjord-like underwater topography (bathymetry) in some parts of the Salish Sea restricts circulation and flushing that would otherwise replenish oxygen in those deep waters.
The role of increased nutrients
Nitrate is an important plant nutrient, but too much nitrate can cause algae "blooms" which use up oxygen.
Nitrate enters the Salish Sea from two sources:
- natural sources from the Pacific Ocean, and
- human-caused pollution.
Studies are underway to help us determine what impact pollution is having on dissolved oxygen levels and declining marine water quality.
What are we doing about it?
Governments are taking actions such as developing farm waste management regulations and upgrading wastewater treatment facilities that will help improve dissolved oxygen levels and overall marine water quality in the Salish Sea.
- Learn more about what we're doing
Below are examples of projects by state and local governments that will help improve marine water quality conditions:
- Washington's Dairy Nutrient Management Act requires 115 licensed cow dairies to develop nutrient management plans. Under these farm plans, many dairies apply the manure they generate to neighboring fields to fertilize feed crops, which means those crops require less commercial fertilizers which can get into waterways.
- Constructing biodigesters to turn animal wastes into a local source of energy also removes nutrients that might otherwise be released into waterways. Washington has several biodigesters now in operation.
- Local governments grants and loans from the Washington Department of Ecology are upgrading wastewater treatment plants to remove nutrients and improve local marine water quality.
- In 2012, new Wastewater System Effluent Regulations came into effect in Canada that will reduce pollution from wastewater treatment plants and lead to improved water quality. The new regulations will require upgrades at two facilities in greater Vancouver, including the Lions Gate Wastewater Treatment Plant in North Vancouver and the Iona Island Wastewater Treatment Plant in Richmond. The governments of Canada, British Columbia, and Capital Regional District also recently announced a new wastewater treatment system for Greater Victoria with an estimated total capital cost of $782.7 million.
Five things you can to do help!
- Use beneficial landscaping techniques such as rain gardens, rain barrels, green roofs and permeable paving to help reduce the need for chemical fertilizers and reduce runoff into ditches and storm drains.
- Scoop your pet's poop. Pet waste is full of bacteria that can get washed into waterways and make people sick if they eat contaminated shellfish. Bag it and place it in the trash.
- If you're a boater, manage your sewage wastes properly. Do not discharge treated or untreated sewage into our waterways. Many marinas provide sewage pumpout as a free or low cost service.
- If you keep livestock, follow manure management practices. Contact your local conservation agency for technical assistance.
- If your home or business uses a septic system, take time to learn how your system works and keep it properly maintained. Ask for maintenance advice from your local health agency or at Puget Sound Starts Here Exit
Related information
The following links exit the site Exit
- Washington Department of Ecology Marine Water Quality Monitoring Program
- Washington Department of Ecology Marine Flight Program (video)
- Hood Canal Dissolved Oxygen Program
- Northwest Association of Networked Ocean Observing Systems - Hypoxia
- Washington Department of Ecology "Eyes over Puget Sound" Surface Conditions Report
- Puget Sound Partnership Vital Signs - Marine Water Quality
- NOAA 2011 Puget Sound Marine Waters Report
- Fisheries and Oceans Canada - State of the Oceans Report 2012
- Fisheries and Oceans Canada - State of Physical, Biological, and Selected Fishery Resources of Pacific Canadian Marine Ecosystems
Scientific references
The following links exit the site Exit
- Albertson, S. L., J. Bos, G. Pelletier, and M. Roberts. 2007. Estuarine flow int he south basin of Puget Sound and its effects on near-bottom dissolved oxygen. WA Department of Ecology, Olympia, WA.
- Albertson, S. L., K. Erickson, J. A. Newton, G. Pelletier, R. A. Reynolds, and M. Roberts. 2002. South Puget Sound Water Quality Study Phase 1. WA Department of Ecology, Olympia, WA.
- Brandenberger, J.M., E.A. Crecelius, P. Louchouarn, S.R. Cooper, K. McDougall, E. Leopold, and G. Liu. 2008. Reconstructing trends in hypoxia using multiple paleoecological indicators recorded in sediment cores from Puget Sound, WA (PDF) (240 pp, 4.6MB). National Oceanic and Atmospheric Administration, Pacific Northwest National Laboratory Report No. PNWD-4013.
- Canadian Council of Ministers of the Environment. 1999. Canadian Water Quality Guidelines for the Protection of Aquatic Life – Dissolved Oxygen (Marine). Winnipeg, Manitoba.
- Cope, B., and Roberts, M. 2013. Review and synthesis of available information to estimate human impacts to dissolved oxygen in Hood Canal. EPA and Washington Department of Ecology. EPA Publication No. 910-R-13-002. WDOE Publication No. 13-03-016.
- More references
- Crawford, W.R. & M.A. Peña (2013): Declining Oxygen on the British Columbia Continental Shelf, Atmosphere-Ocean, DOI:10.1080/07055900.2012.753028
- Diaz, R. J. and R. Rosenberg. 2008. Spreading dead zones and consequences for marine ecosystems. Science 321:926-929.
- Fisheries and Oceans Canada. Pacific Region. Institute of Ocean Sciences Data Archive. Ocean Sciences Division. [Internet]. Cited 2012-12-12.
- Krembs, C. 2012. Marine Water Condition Index: Washington State Department of Ecology. Washington State Department of Ecology, Olympia, WA. Publication No. 12-03-013. https://fortress.wa.gov/ecy/publications/summarypages/1203013.html
- Gilbert, D. N. N. Rabalais, R. J. Diaz and J. Zhang. 2010. Evidence for greater oxygen decline rates in the coastal ocean than in the open ocean. Biogeosciences. 7: 2283-2296.
- Mohamedali, T., M. Roberts, B. Sackmann, A. Kolosseus 2011a. Puget Sound Dissolved Oxygen Model Nutrient Load Summary for 1999-2008. Washington State Department of Ecology, Olympia, WA. Publication No. 11-03-057.
- Newton, J. A., A. L. Thomson, L. B. Eisner, G. A. Hannach, and S. L. Albertson. 1995. Dissolved oxygen concentrations in Hood Canal: are conditions different than forty years ago? In Puget Sound Research Conference Proceedings 1995.
- NOAA OAR Special Report - Scientific Summary of Ocean Acidification in Washington State Marine Waters. November, 2012. Contribution No. 3934 from NOAA/Pacific Marine Environmental Laboratory.
- Paulson, A. J., C. P. Konrad, L. M. Frans, M. Noble, C. Kendall, E. G. Josberger, R. L. Huffman, and T. D. Olsen. 2007. Freshwater and saline loads of dissolved inorganic nitrogen to Hood Cana and Lynch Cove, Washington. U.S. Gelogical Survey, Reston, VA.
- Palsson, W. A., R. E. Pacunski, T. R. Parra, and Beam.J. 2008. The effects of hypoxia on marine fish populations in Southern Hood Canal, Washington. American Fisheries Society Symposium 64:255-280.
- Roberts, M., J. Bos, and S. L. Albertson. 2008. South Puget Sound dissolved oxygen study interim data report. WA Department of Ecology, Olympia, WA.
- Ryan Kelly and Jenny Grote Stoutenburg. Center for Ocean Solutions Stanford University. July 2012. Washington State’s Legal and Policy Options for Combating Ocean Acidification in State Waters. A Report to the Washington State Blue Ribbon Panel on Ocean Acidification.