Air Quality
Summary
Improving
13 of the 14 air monitoring stations in our study meet both Canadian and U.S. standards, and air quality is generally improving thanks to new actions in Washington and British Columbia that control sources of air pollution.
Sustainable Perspective
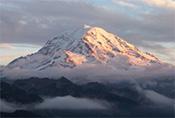
When the ancient peak Tahoma shrugs off its misty shroud people say "the mountain is out."
People who have lived here all their lives still stop and stare when Mount Rainier reveals itself. This mountain, renamed by Captain Vancouver in 1792, is at once the most public symbol of the Pacific Northwest and its most sacred private icon. It inspires a feeling akin to spiritual awe: reverence, adoration, humility.
Mount Rainier National Park is located downwind of a number of urban and industrial areas and is not isolated from the by-products of industrialization. Human-made air pollutants are transported long distances. Stationary and mobile sources of pollution include a variety of sources in the Puget Sound region as far north as Vancouver, and as far south as Portland.
Pollution traveling across the Pacific Ocean from Asia are also deposited in lakes, streams, and on land within the Cascade mountain range at high elevations, affecting chemistry, ecology and the visual perspective of this iconic place.
EPA and Environment Canada have set federal air pollution reduction targets for tiny particles of air pollution that are 2.5 micrometers in diameter and smaller (also called PM2.5). These fine particles - such as those found in smoke or haze - are 100 times smaller than the width of a human hair. They can be inhaled deeply into a person's respiratory system and cause severe health problems. They also contribute to poor visibility and can impact the function of the ecosystem.
What's happening?
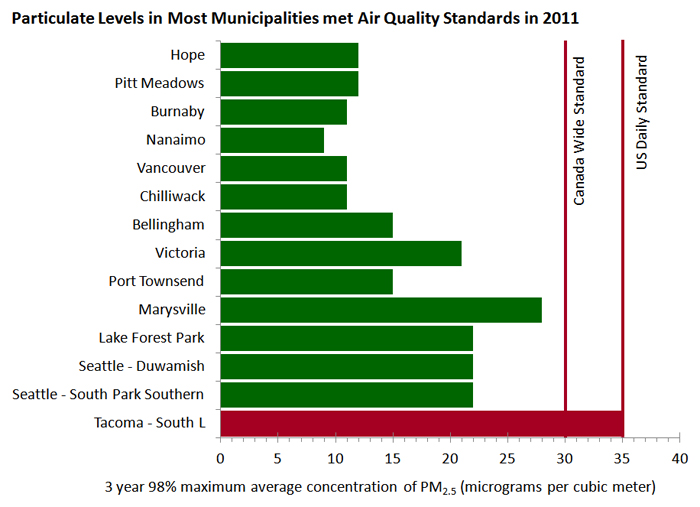
Levels of fine particulate at 13 of the 14 air monitoring stations shown in the map below meet both the Canada Wide Standard and the U.S. Daily Standard. Levels of fine particulate in south Tacoma exceed the more stringent Canada Wide Standard but meet the U.S. Daily Standard.
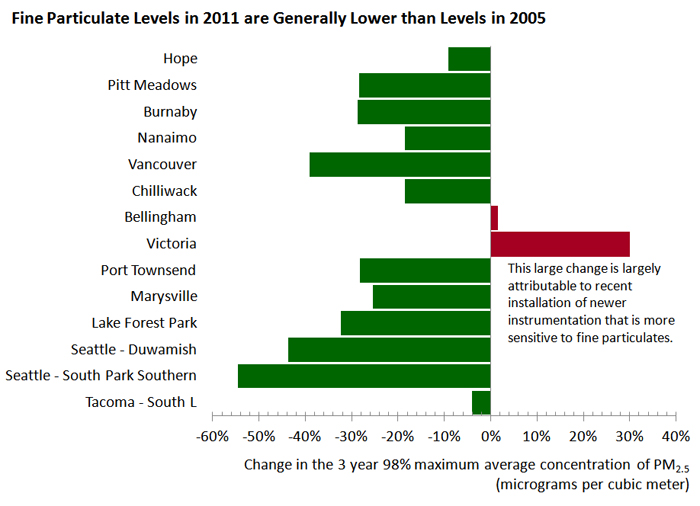
12 of the stations showed improving conditions between 2005 and 2011. Fine particulate levels at Bellingham were marginally higher in 2011 than 2005. Higher levels were also observed at Victoria, however this may be partly due to the installation of new instruments that are more sensitive to fine particulates.
- Chart showing fine air particulate levels in 2011 compared to federal air quality standards
- Chart showing the difference in fine air particulate levels between 2005 and 2011
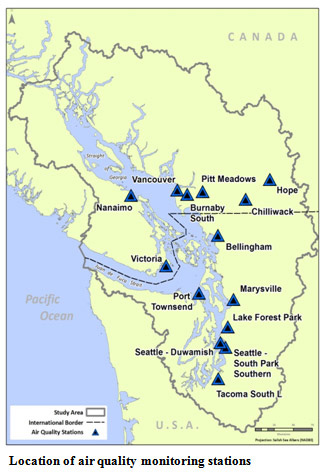
- List of air monitoring station locations
Location of the air 14 monitoring stations studied in this report.
- Bellingham, Washington
- Burnaby South, British Columbia
- Chilliwack, British Columbia
- Hope, British Columbia
- Lake Forest Park, Washington
- Marysville, Washington
- Nanaimo, British Columbia
- Pitt Meadows, British Columbia
- Port Townsend, Washington
- Seattle (Duwamish), Washington
- Seattle (South Park), Washington
- Tacoma, Washington
- Vancouver, British Columbia
- Victoria, British Columbia
Why is it important?
Elevated levels of fine particulate can affect human health, the environment and the economy. Fine particulates can be inhaled deeply into the respiratory system where they may aggravate existing respiratory and cardiovascular disease, reduce lung function, increase respiratory symptoms, and lead to premature death. Fine particulates may also provide a way for toxics - including carcinogens - to get deep into a person's respiratory system.
Research indicates that fine particulates may affect people's health even at levels below current federal health standards. Negative health effects lead to increased costs to the medical system and are associated with greater numbers of sick days in the work force.
High levels of fine particulates can also impair visibility, which has measureable impacts on tourism and decreases the quality of life for Salish Sea residents.
- Learn more about why it's important
Economic Impact
The economic benefits of reducing fine particulates are also significant. The Border Air Quality Study - an economic assessment led by the University of British Columbia - estimated that a 1% improvement in PM2.5 would yield $29 million in annual savings in the Lower Fraser Valley in 2010. In Washington, the total annual costs estimated for adult and childhood asthma was $127.8 million in 2004. This estimate reflects asthma cases attributable to environmental contaminants such as PM2.5 and includes both direct health care costs and indirect costs, such as lost productivity and premature death. In British Columbia, direct medical costs for asthma were estimated at $42 million in 2000.
Why is it happening?
Fine particulates have natural and human-made sources. Primary sources of fine particulates in the Salish Sea ecosystem are transportation (e.g. cars, trucks, trains, ships), and woodstoves and fireplaces, particularly during winter months.
- Learn more about why it's happening
In 2005, an air emissions inventory of Vancouver, the southwest portion of the Fraser Valley, and Whatcom County looked at air pollution from various sources. Mobile sources (such as cars and other on-road vehicles, trains, and ships) and area sources (such as woodstoves and commercial boilers) represent over 70% of fine particulate emissions. Point sources (such as large industrial facilities) and road dust contribute the remaining 30%.


What are we doing about it?
Agencies are focused on actions to reduce emission sources from the following sources:
- Locomotives and rail yards
- Marine vessels and port operations
- Wood burning
- Vehicles and non-road engines
- Learn more about what we're doing
Below are examples of actions currently in place to reduce emission sources of fine particulates:
Emission Control Areas in Coastal B.C. and Washington
In 2010, the International Maritime Organization accepted a joint Canada-U.S. application to designate parts of coastal waters in B.C. and Washington as Emission Control Areas. These areas have more strict standards for marine fuels, as well as sulphurous oxide and nitrogen oxide emissions. Canada is currently amending regulations under the Canada Shipping Act to implement and enforce the newly revised regulations.
Wood Smoke Reduction Efforts in Washington
Washington has some of the most progressive wood smoke reduction laws in the U.S. Wood and pellet stoves sold in Washington must be nearly twice as clean as the national EPA emission standard. Washington also regulates factory-built fireplaces, masonry heaters and other solid fuel burning devices, and does not permit the sale or installation of outdoor wood-fired boilers. Burn bans, fuel restrictions (e.g. no garbage burning) and wood fuel moisture requirements have been in use since 1995.
British Columbia Wood Stove Exchange Program
The B.C. Wood Stove Exchange Program provides financial incentives for upgrading old wood stoves. It also provides education to wood burners on how to improve their burning practices. In December 2011, B.C. announced $200,000 in new funding to support change-out programs in 12 communities. By the end of 2012, over 5,000 old stoves are expected to have been exchanged for cleaner burning models. This includes 106 exchanges in the Fraser Valley Regional Disctrict, and 225 in Metro Vancouver - resulting in a reduction of over 310 tonnes (683,000 pounds) of PM2.5 per year.
Emissions from Non-road Diesel Engines in Metro Vancouver
In January 2012, a new bylaw for non-road diesel engines (such as excavators, backhoes, and stationary equipment) came into effect in Metro Vancouver. The bylaw will reduce emissions of diesel particulate matter from older, non-road diesel engines operating in the region. Engine owners can reduce their fees or receive a refund by decreasing emissions or retiring an engine. Agencies are also attempting to improve monitoring efforts and improve communication and education on human health concerns and best practices.
Five things you can do to help!
- Walk or ride a bike when possible, or take public transportation.
- Ask your energy supplier for a home audit to find ways to help you save energy and money.
- Have your gas appliances and heater regularly inspected and maintained.
- Turn off office equipment, computers, printers, and fax machines at night or after hours.
- During the day open the blinds and turn off the lights. Dress in layers instead of reaching for the thermostat.
Related information
The following links exit the site Exit
- Airwatch Northwest
- Washington Air Quality Advisory (WAQA)
- U.S. National Park Service Air Quality Cameras
- Georgia Basin-Puget Sound International Airshed Strategy Health Impacts
- University of British Columbia Border Air Quality Study
- Environment Canada - Air Quality
- B.C. Air Quality
- B.C. Lung Association State of the Air Report
- Metro Vancouver Air Quality
- Fraser Valley Regional District Air Quality
Scientific references
The following links exit the site Exit
- Thomson, B. 2004. Characterization of the Georgia Basin Puget Sound Airshed. Environment Canada and United States Environmental Protection Agency.
- Bates, D.V., J. Koenig, M. Bauer. 2003. Health and Air Quality 2002 Phase 1 Methods for Estimating and Applying Relationships between Air Pollution and Health Effects (PDF) (133 pp, 2MB). Prepared for British Columbia Lung Association.
- Environmental Protection Agency. 2009. Integrated Science Assessment for Particulate Matter. Environmental Protection Agency, Research Triangle Park, NC. EPA/600/R-08/139F.
- Grantz, D.A. 2003. Ecological effects of particulate matter. Environment International. 29(2003): 213-239.
- CCME, 2000. Canada Wide Standard for PM.
- More references
- EPA. 2006. National Ambient Air Quality Standards for Particulate Matter. Federal Register. 40CFR Part 50 (EPA-HQ-OAR-2001; FRL-8225-3; RIN 2060-AI44).
- EPA-EC. 2002. Transboundary Ecosystem Indicators.
- EPA-EC. 2005. Transboundary Ecosystem Indicators.
- So, Rita, 2011. Personal Communication.
- BC Lung Association. 2010. State of the Air 2010.
- Border Air Quality Study. 2008. Summary Findings from the Border Air Quality Study. University of British Columbia, University of Victoria and University of Washington.
- RWDI Air Inc. 2005. Health and Air Quality 2005 – Phase 2: Valuation of Health Impacts from Air Quality in the Lower Fraser Valley Airshed. Vancouver, BC.
- Crane Management Consultants. 2005. Socio-Economic Considerations of Cleaning Greater Vancouver’s Air. Prepared for the Greater Vancouver Regional District.
- Davies, K. 2005. Economic Costs of Diseases and Disabilities Attributable to Environmental Contaminants in Washington State. Prepared for the Collaborative for Health and Environment – Washington Research and Information Working Group.
- Sadatsafavi, M. 2010. Direct health care costs associated with asthma in British Columbia. Can Respir J. 17(2): 74-80.
- McNeill, R. and A. Roberge. 2000. The Impact of Visual Air Quality on Tourism Revenues in Greater Vancouver and the Lower Fraser Valley. Environment Canada. Georgia Basin Ecosystem Initiative Report Number EC/GB-00-028.
- Border Air Quality Strategy. 2005. Maintaining air quality in a transboundary air basin: Georgia Basin-Puget Sound. Canada – United States Air Quality Agreement. Prepared for Environment Canada and US Environmental Protection Agency.
- Metro Vancouver. 2010. 2005 Lower Fraser Valley Air Emissions Inventory, Forecast and Backcast – Detailed Listing of Results and Methodology.
- Ross and Associates Environmental Consulting. 2007. Northwest Ports Clean Air Strategy. Prepared for the Port of Seattle, Port of Tacoma and Vancouver Port Authority.
- Ross and Associates Environmental Consulting. 2009. Northwest Ports Clean Air Strategy: 2008 Implementation Report. Prepared for the Port of Seattle, Port of Tacoma and Vancouver Port Authority.
- Kotchenruther, Robert, personal communication, 2011.
- Vingarzan, R., 2010. LFV Visibility Pilot Science Summary. Report prepared for the British Columbia Visibility Coordinating Committee, June, 2010. Environment Canada, Meteorological Services of Canada, Pacific and Yukon Region, #201-401 Burrard Street, Vancouver, BC.