2011 NATA: Assessment Methods
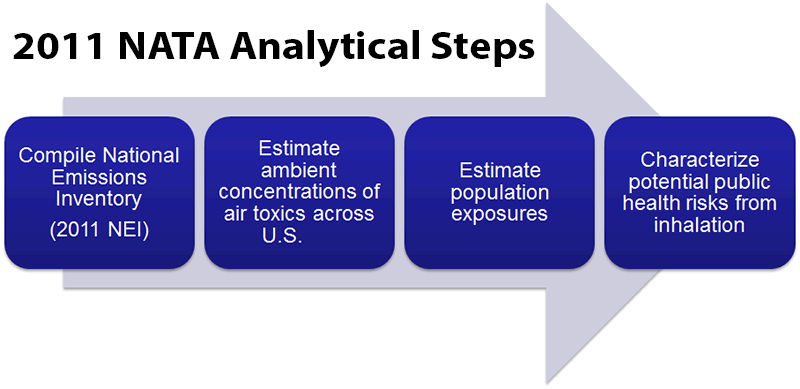
The NATA analysis comprises four main parts:
- Compile a National Emissions Inventory (NEI)
- Estimate ambient concentrations of air toxics across the U.S.
- Estimate population exposures
- Characterize potential health risks from inhalation
Compile a National Emissions Inventory (NEI)
The 2011 National Emissions Inventory (NEI) is the underlying basis for the emissions used in this assessment. To develop the NATA inventory, changes are made to the NEI as a result of reviews and quality assurance checks conducted by state and local agencies, and other reviewers. Certain processing steps are also conducted, for example, to place individual chemicals into groups and to adjust emission rates of metal compounds based on the toxic metal proportion of the compound’s molecular weight.
Emission source types included in NATA are:
- major stationary sources, also referred to as point sources (e.g., large waste incinerators, factories);
- area and other smaller stationary sources, also referred to as nonpoint sources (e.g., dry cleaners, small manufacturers);
- onroad and nonroad mobile sources (e.g., cars, trucks, boats);
- fires and biogenic sources;
In addition, estimates were also included for:
- background emissions (e.g., natural sources, anthropogenic air toxics emitted in prior years that persist in the environment, air toxics emitted from distant sources); and
- secondarily formed emissions (i.e., chemicals not directly emitted from a source but formed in the atmosphere through photochemical reactions, examples include formaldehyde, acetaldehyde, and acrolein).
For more information on emission inventories, see the Air Emissions Inventory web page. More detailed information on development of the NATA inventory may be found in Section 2, Emissions, of the Technical Support Document (TSD). For those sources, such as non-point sources without specific known locations that must be allocated spatially across an area, more information can be found in Section 3, Air Quality Modeling and Characterization, of the TSD.
Estimate ambient concentrations of air toxics across the U.S.
Using two models, EPA estimates ambient concentrations of air toxics across the United States. The dispersion model AERMOD (in HEM-3) and the chemical transport model CMAQ are both used in order to take advantage of the strengths of each model.
CMAQ is used to conduct urban to regional scale simulations of multiple air-quality issues. Its state-of-the-science capabilities bring together key physical and chemical functions associated with the dispersion and transformations of air pollution at various scales. A 12 km by 12 km grid resolution is used. Several abilities of CMAQ that contribute to its strengths for the 2011 NATA include: conservation of mass (i.e., if some mass of a pollutant leaves an area, it is accounted for in the new area); consideration of long-range transport of pollutants; and estimated concentrations of secondarily-formed pollutants (e.g., formaldehyde). Forty of the highest risk HAP were modeled in CMAQ. Fires and biogenic emissions were only modeled in CMAQ. Secondary formation of pollutants was only estimated in CMAQ. CMAQ provides an ambient air concentration for each grid.
AERMOD, EPA’s preferred dispersion model for regulatory purposes, is used to estimate ambient concentrations at fine spatial scales. For the 2011 NATA, AERMOD was run within the Human Exposure Model, version 3 (HEM-3) and for this discussion, AERMOD is the pertinent component of HEM-3. AERMOD receptor locations are based on the centroids of populated census blocks, monitoring site positions, and five evenly distributed points within each 12 km CMAQ grid cell. Block-level concentrations are population-weighted to calculate census tract-level concentrations. All pollutants in NATA were modeled using AERMOD. All emission source types except fires and background estimates were modeled in AERMOD. AERMOD provides an ambient air concentration for each receptor.
The air quality modeling for 40 of the most prevalent and highest risk air toxics used a hybrid method combining the fine spatial scale and source attributions of AERMOD (using HEM-3) with the full treatment of chemistry and transport afforded by CMAQ. Because AERMOD treats all species as chemically non-reactive, the emissions and meteorological data used in CMAQ were processed further to generate AERMOD inputs consistent with CMAQ. This hybrid approach, combining CMAQ and AERMOD (in HEM-3), reflects an evolution of national-scale modeling of HAPs that attempts to optimize characterization of non-reactive and reactive species across multiple spatial scales. Using this hybrid approach (described in more detail in Section 3 of the TSD), EPA can “anchor” the ambient AERMOD receptor concentrations to the ambient CMAQ grid concentrations. This allows mass to be conserved and avoids double counting, both improvements over the 2005 NATA.
Using a hybrid approach (described in more detail in Section 3 of the Technical Support Document) EPA can “anchor” the ambient AERMOD receptor concentrations to the ambient CMAQ grid concentrations. This allows mass to be conserved and avoids double counting, both improvements over the 2005 NATA.
For NATA, EPA uses background concentrations to represent the contributions to ambient concentrations of air toxics resulting from natural sources, emissions of persistent chemicals that occurred in previous years, and long-range transport from distant sources. These background concentrations are intended to represent levels of pollutants found in a particular year even if there had been no local anthropogenic emissions of those pollutants during that year. For pollutants included in the CMAQ modeling runs, background was included in the CMAQ run. For those pollutants not included in the CMAQ run (i.e., AERMOD-only pollutants), a spatially uniform remote background concentration was calculated and added to the modeled concentration. More information about background concentrations can be found in Section 3 and Appendix E of the TSD. Using the hybrid approach (with the addition of background concentrations where appropriate), EPA estimates the ambient concentrations at every populated census block receptor. For each census tract, EPA uses the population of each block to weight the concentrations and create a population-weighted average across the census tract.
More information about these models and the process for generating ambient concentration data may be found in Section 3 of the TSD.
Estimate population exposures across the U.S.
Ambient concentrations are actually surrogates for exposure, as important exposure variables (e.g., human activity patterns, etc.) are not explicitly addressed by AERMOD or CMAQ. The census tract level estimated ambient concentrations are used as inputs to the screening-level inhalation exposure model, HAPEM7. Estimating exposure is important because the average concentration of a pollutant that people breathe may be significantly higher or lower than the concentration at a fixed location.
Through a series of calculations, HAPEM7 makes use of census data, human activity pattern data, ambient air quality levels, climate data, and indoor/outdoor concentration relationships to estimate an expected range of “apparent” inhalation exposure concentrations for groups of individuals. The best estimate of exposure is estimated for a hypothetical “typical” person for a given census tract.
HAPEM simulation modeling was conducted for the 1999 NATA analysis for each combination of pollutant, census tract, and source group. Because running HAPEM requires substantial time and resources, for the 2002 and 2005 NATAs, EPA relied on the exposure factors derived for the 1999 analysis and applied them to the modeled ambient concentrations. The 2011 NATA used a mixture of new simulations and existing exposure factors. New simulations were conducted for the following pollutants: coke oven emissions, diesel PM, benzene, 1,3-butadiene, generic PAHs, chromium VI, and nickel. Some of these pollutants were also used as surrogates for other similar pollutants (e.g., benzene was the surrogate for all other gas-phase pollutants).
For more information about the model, see the HAPEM7 Users Guide. For more information about the method, see Section 4, Estimating Exposures for Populations, of the TSD.
Characterize potential health risks from inhalation
EPA combines the census tract level exposure concentration estimates (generated in the previous step) with available unit risk estimates and inhalation reference concentrations to calculate risks and hazard quotients, respectively, for each pollutant. Risks or hazard quotients were calculated for about 140 pollutants. More details about unit risk estimates, inhalation reference concentrations, and risk characterization can be found in the following locations: the Dose-Response Assessment web page; in Sections 5, Characterizing the Effects of Air Toxics of the TSD; and in Section 6 of the TSD, Characterizing Risks and Hazards in NATA.
The 2011 NATA results section presents ambient and exposure concentrations, cancer and noncancer risks at the tract, county, and state levels. The noncancer results are presented for the respiratory endpoint, which previous NATA analyses have shown is a driver of noncancer risks.
It is important to consider when using these results that NATA is a screening-level assessment and only suitable to answer certain questions. The variability and uncertainty in the assessment should be kept in mind. For example, results are more uncertain at finer geographic scales. And, results should not be used to compare different areas of the country or to rank different areas. This is because emissions, air concentrations, exposures, and risks are not the same throughout the U.S., and are not the same for everyone. It is important to have an idea of how these factors vary throughout the U.S. In addition, the EPA seeks to protect health with reasonable confidence. But scientific estimates of air concentrations, exposures, and risks always involve assumptions that simplify the real situation and introduce uncertainties in order to make the assessment possible. A more complete discussion of variability and uncertainty is found in Section 7, Variability and Uncertainty Associated with NATA, of the TSD.