Global Mitigation of Non-CO2 Greenhouse Gases, 2010-2030: Introduction
Climate change is influenced by a number of social and environmental factors. The change in our Earth’s climate is largely driven by emissions of greenhouse gases (GHGs) to the atmosphere. While some GHG emissions occur through natural processes, the largest share of GHG emissions come from human activities. GHG emissions from anthropogenic sources have increased significantly over a relatively short time frame (~100 years) and are projected to grow appreciably over the next 20 years.
Policy development and planning efforts are underway at all levels of society to identify climate change strategies that effectively reduce future greenhouse gas emissions and prepare communities to adapt to the Earth’s changing climate. GHG mitigation analysis continues to play an important role in the formation of climate change policy. A large body of research has been dedicated to analyzing ways to reduce carbon dioxide (CO2) emissions.
While this work is critical to developing effective climate policy, other GHG gases can play an important role in the effort to address global climate change. These non-carbon dioxide (non-CO2) GHGs include methane (CH4), nitrous oxide (N2O), and a number of industrial gases such as fluorinated gases.
Non-CO2 greenhouse gases are more potent than CO2 (per unit weight) at trapping heat within the atmosphere. Global warming potential (GWP) is the factor that quantifies the heat trapping potential of each GHG relative to that of CO2. The table to the right shows the list of GHG gases with their GWP values that are considered in this report.
Marginal abatement cost curves (MACCs) are an analytical tool commonly used in mitigation analysis to assist policy makers in understanding the opportunities for reducing GHG emissions and the relative cost of implementation. MACCs provide information on the amount of emissions reductions that can be achieved as well as an estimate of the costs of implementing the GHG abatement measures. This figure shows the Global MACC for all non-CO2 GHGs in 2030.
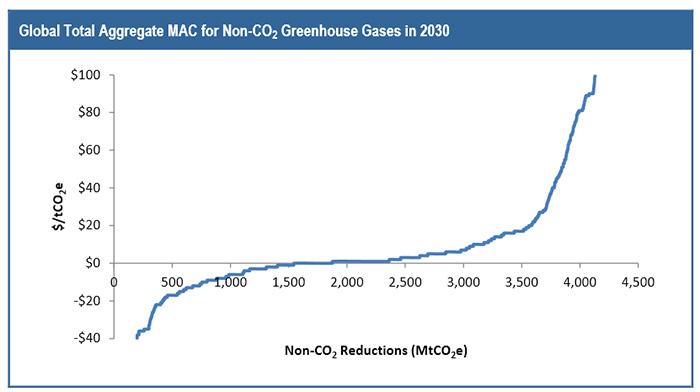
Worldwide, the potential for cost-effective non-CO2 GHG abatement is significant. The figure shows the global total aggregate MAC for the year 2030. Without a price signal (i.e., at $0/tCO2e), the global mitigation potential is greater than 1,800 million metric tons of CO2 equivalent (MtCO2e), or 12% of the baseline emissions. As the break-even price rises, the mitigation potential grows. Significant mitigation opportunities could be realized in the lower range of break-even prices. For example, the mitigation potential at a price of $10/tCO2e is greater than 3,000 MtCO2e, or 20% of the baseline emissions, and greater than 3,600 MtCO2e or 24% of the baseline emissions at $20/tCO2e. In the higher range of breakeven prices, the MACC becomes steeper, and less mitigation potential exists for each additional increase in price.
As the figure shows, higher levels of emissions reductions are achievable at higher abatement costs expressed in dollars per metric ton of CO2 equivalent ($/tCO2e) reduced. The quantity of emissions that can be reduced, or the abatement potential, is constrained by the availability and effectiveness of the abatement measures (emission reduction technologies).
About this Report
U.S. EPA has recently updated its International MACC model for the Non-CO2 anthropogenic sources that include energy, waste, industrial processes, and agricultural activities. The results of this analysis are published in the EPA report Global Mitigation of Non-CO2 Greenhouse Gases: 2010-2030 and include improved country-level resolution and increased transparency in the economic and technological assumptions underlying the abatement measures considered in the analysis. This report is intended to provide a brief summary of the abatement potential and costs of implementing specific abatement technologies. Readers interested in more technical details of the analysis should refer to the full technical report, which is available at Download the Report. For more information on emissions and projections of non-CO2 greenhouse gases, visit the International Non-CO2 Emissions and Projections page. Question or comments on these reports can be directed to Shaun Ragnauth (ragnauth.shaun@epa.gov).