Exposure Assessment Tools by Routes - Ingestion
Overview

An exposure route![]() exposure routeThe way a chemical pollutant enters an organism after contact, e.g., by ingestion, inhalation, or dermal absorption. is the way that a contaminant enters an individual or population after contact (IPCS, 2004). Typically, exposure occurs by one of three exposure routes—inhalation, ingestion, or dermal.
exposure routeThe way a chemical pollutant enters an organism after contact, e.g., by ingestion, inhalation, or dermal absorption. is the way that a contaminant enters an individual or population after contact (IPCS, 2004). Typically, exposure occurs by one of three exposure routes—inhalation, ingestion, or dermal.
Ingestion exposure can occur via consumption of contaminated food, water and other liquids. Food can contain chemical residues as a result.
- intentional application (e.g., pesticide use),
- deposition of particulate matter onto edible produce (e.g., from atmospheric pollutants), and/or
- biotic uptake and accumulation from contaminated soil or water (e.g., irrigation water, update of contaminants by fish or livestock).
Ingestion exposure can also occur via the intentional or inadvertent non-dietary ingestion of soil, dust, or chemical residues on surfaces or objects that are contacted via hand-to-mouth or object-to-mouth activity (especially for young children).
Soil can become contaminated as a result of direct discharges to soil, atmospheric deposition, or transport from other media (e.g., water). Contaminated soil can also be tracked indoors and contribute to contaminated house dust.
Estimating exposure from ingestion requires information on the concentration of the contaminant in the medium that is ingested, ingestion rate, and the timeframe of exposure. Estimating exposure from non-dietary ingestion may also require information on the frequency of hand-to-mouth or object-to-mouth contact.
Calculations to estimate dose from dietary and non-dietary ingestion are provided in this module as are various tools available for evaluating potential exposure concentrations. Exposure scenarios, exposure factors, and guidance for assessing exposure via ingestion are also provided.
Methods
When a contaminant is taken into the body by ingestion, the amount that gets into the body in a biologically available form is called the dose![]() doseThe amount of a substance available for interactions with metabolic processes or biologically significant receptors after crossing the outer boundary of an organism.. There are a few different ways to measure dose (U.S. EPA, 1992):
doseThe amount of a substance available for interactions with metabolic processes or biologically significant receptors after crossing the outer boundary of an organism.. There are a few different ways to measure dose (U.S. EPA, 1992):
- Potential dose is the amount of contaminant ingested (i.e., amount that gets in the mouth), not all of which is actually absorbed.
- Applied dose is the amount of contaminant at the absorption barrier (e.g., gastrointestinal [GI] tract) that can be absorbed by the body. The applied dose might be smaller than the potential dose if the contaminant is only partially bioavailable.
- Internal dose is the amount of contaminant that gets past the exchange boundary (GI tract) and into the blood, or the amount of the contaminant that can interact with organs and tissues to cause biological effects.
- Biologically effective dose is the amount of contaminant that interacts with the internal target tissue or organ.
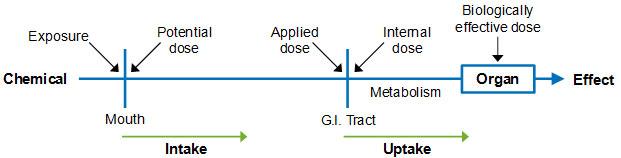 Illustration of Ingestion Route: Exposure and Dose (U.S. EPA, 1992)
The following general equation may be used to estimate the average daily dose![]() average daily doseThe mean amount of an agent to which a person is exposed on a daily basis, often averaged over a long period of time. U.S. EPA is transitioning from average daily dose methodologies to more refined aggregate and cumulative approaches for estimating exposure across each lifestage. See also Lifetime average daily dose (LADD) and Time-averaged exposure. (ADD) from intake of food, water, soil, dust, or other non-dietary exposure from hand- or object-to-mouth contact.
average daily doseThe mean amount of an agent to which a person is exposed on a daily basis, often averaged over a long period of time. U.S. EPA is transitioning from average daily dose methodologies to more refined aggregate and cumulative approaches for estimating exposure across each lifestage. See also Lifetime average daily dose (LADD) and Time-averaged exposure. (ADD) from intake of food, water, soil, dust, or other non-dietary exposure from hand- or object-to-mouth contact.
Average Daily Dose = Concentration x Intake Rate / Body Weight
Algorithms for specific ingestion pathways are provided in the Calculations tab of this module.
Calculations
The following algorithm may be used for estimating the average daily potential dose from ingestion of food (including aquatic biota), water, or soil and dust. The potential dose![]() potential doseThe amount of a chemical contained in material ingested, air breathed, or bulk material applied to the skin. of a contaminant is the product of the contaminant concentration, ingestion rate, exposure duration, and exposure frequency divided by the averaging time and body weight.
potential doseThe amount of a chemical contained in material ingested, air breathed, or bulk material applied to the skin. of a contaminant is the product of the contaminant concentration, ingestion rate, exposure duration, and exposure frequency divided by the averaging time and body weight.
The equation parameters below must be defined for each ingestion exposure scenario, and all parameters must be expressed in consistent units; in some cases, unit conversion factors may be necessary. Average Daily Dose (ADD) is generally expressed as mass of contaminant per unit body weight over time (e.g., mg/kg-day).
ADD = Cmedium x IngR x EF x ED / BW x AT
Where:
ADD = Average daily potential dose (mg/kg-day)
Cmedium = Concentration of contaminant in medium (e.g., mg/L, mg/g)
IngR = Ingestion rate (e.g., L/day, g/day)
EF = Exposure frequency (days/year)
ED = Exposure duration (years)
BW = Body weight (kg)
AT = Averaging time (days)
- Cmedium is the concentration in water, food, soil/dust, or aquatic biota; either a measured or modeled value.
- Ingestion rate (IngR) is the amount of food, water, or soil/dust containing the contaminant that an individual ingests during a specific period of time; expressed in units of mass or volume per unit time, such as g/day or L/day.
- IngR units should be consistent with the concentration term used in the exposure algorithm. For example, concentrations expressed in terms of whole, wet, or fresh weight (i.e., mg of contaminant per g of whole food) should be used with ingestion rates indexed to the whole weight of the food consumed (i.e., g of whole food consumed per day). Likewise, dry weight concentrations or lipid weight concentrations should be used with ingestion rates indexed to dry or lipid weights, respectively.
Ingestion Rates Vary within Populations
Assessors should choose ingestion rate data that best represent the population for which exposures are being assessed. For example, some assessments might focus on certain subsets of the general population (e.g., farmers, recreational fishermen) whose ingestion rates might vary from those of the general population. Age also affects ingestion rate.
- Body weight (BW) of an individual, typically expressed in kilograms (kg), is also included so that the dose is normalized to that value. Sometimes the ingestion rate is already normalized to body weight (e.g., in units of mg/kg-day). In this case, a separate term for body weight would not be necessary.
- Temporal parameters in the dose equation include:
- Exposure frequency (EF) refers to the frequency with which the exposure occurs and might be provided in days per year or events per day.
- Exposure duration (ED) is the amount of time that an individual or population is exposed to the contaminant being evaluated and is typically provided in years.
- Averaging time (AT) is the amount of time over which exposure is averaged and is equal to ED for assessing non-cancer risks. For chronic assessments (e.g., cancer), potential lifetime average daily dose (LADD) is calculated in which lifetime (LT, in days) is substituted for AT.
Exposure parameter inputs (e.g., ingestion rates, body weights, and relevant patterns of behavior such as timeframe of exposure) can be obtained from the Exposure Factors Handbook: 2011 Edition (U.S. EPA, 2011) or other sources of exposure factor data (see Factors tab in this module). Ingestion of contaminated media could occur over short durations (e.g., breastfeeding infant) or longer time periods (e.g., residence time for a receptor consuming homegrown food).
For ingestion of surface residues from hand-to-mouth or object–to-mouth contact, the following algorithm for average daily potential dose may be used.
ADD=Csurface residue x CR x EV x ET x EF x ED / BW x AT
Where:
ADD = Average daily potential dose (mg/kg-day)
Csurface residue = Concentration of contaminant on the surface of the hands or objects that are mouthed (mg/cm2)
CR = Contact rate with contaminated surface (cm2/event)
EV = Event frequency (events/hour)
ET = Exposure time (hours/day)
EF = Exposure frequency (days/year)
ED = Exposure duration (years)
BW = Body weight (kg)
AT = Averaging time (days)
For non-dietary ingestion exposures there additional parameters related to contact frequency and timeframe of exposure are incorporated into the ADD equation.
- Contact rate (CR) represents either the surface area of the hand or the surface area of the object being mouthed.
- Event frequency (EV) represents the number of times the hand or object is mouthed over a specified period of time (e.g., events /hour).
- Exposure time (ET) is added to represent the timeframe over which the transfer of residues from the surface or object to the receptor occurs.
Additional information on exposure scenarios involving the ingestion route can be found in the Indirect Estimation Module in the Approaches Tool Set of EPA ExpoBox. The Exposure Calculation Spreadsheet (XLSX) (1 pp, 16 K) estimates ingestion dose when user-defined values are entered for the various exposure parameters that are highlighted in BOLD.
Concentrations
Sources of contamination to food, water, and soil and dust are discussed in the Media Tool Set of EPA ExpoBox. Media-specific concentrations are needed for estimating exposure via the ingestion route. Data and tools that can be used to estimate concentrations are also provided in the Media Tool Set of EPA ExpoBox.
Measuring Concentrations
Information on sampling techniques and analytical methods is available to support the measurement of contaminants in potentially ingested media.
Modeling Concentrations
In the absence of measurement data, a variety of models can be used to estimate contaminant concentrations in food, water, soil, or other materials that may be ingested. A number of resources are available to assist in these modeling efforts.
Available Data
There are a number of information sources that provide monitoring data on contaminant concentrations in potentially ingested media.
Scenarios
Ingestion exposure can be estimated by first defining the exposure scenario![]() exposure scenarioA set of facts, assumptions, and inferences about how exposure takes place that aids the exposure assessor in evaluating or quantifying exposure. of interest. Exposure scenarios typically include information on the sources and pathways of exposure, contaminants of concern, and receptor populations. They might also describe a receptor population’s activities that may affect exposure and the timeframe over which exposure occurs.
exposure scenarioA set of facts, assumptions, and inferences about how exposure takes place that aids the exposure assessor in evaluating or quantifying exposure. of interest. Exposure scenarios typically include information on the sources and pathways of exposure, contaminants of concern, and receptor populations. They might also describe a receptor population’s activities that may affect exposure and the timeframe over which exposure occurs.
Ingestion exposure could occur from the dietary intake of contaminated food or water. It could also occur from the non-dietary ingestion of soil, dust, or chemical residues on surfaces or objects that are contacted via hand-to-mouth or object-to-mouth activity.
The table below provides some examples of ingestion scenarios. The list of examples is not meant to be exhaustive. There are numerous other ingestion scenarios that may be constructed based on the specific needs of the assessment. There are also numerous variations of the examples provided in the table.
| Medium | Receptor Population | Activity/Timeframe | Intake Rate | Exposure Period |
|---|---|---|---|---|
| Tap water | General population; adults | Drinking water at home and away from home over lifetime | Daily total tapwater intake [Table 3-1] |
Chronic |
| Tap water; localized | School children | Drinking water during time at school; elementary school years [Table 16-17] |
Portion of daily community tapwater ingestion rate [Table 3-1] |
Sub-chronic |
| Swimming pool water | Recreating adults and children | Swimming over the short-term [Table 16-1] |
Ingestion rate while swimming [Table 3-5] |
Acute |
| Soil from contaminated site | Occupational; adults | Site-specific construction occupational tenure [Table 16-8] |
Soil intake rate [Table 5-1] |
Chronic |
| House dust | Young children | Routine intake during time spent indoors; less than lifetime [Table 16-1] |
Dust intake rate [Table 5-1] |
Sub-chronic |
| Residues on indoor surfaces | Residential children | Mouthing during time spent indoors; less than lifetime [Table 16-1] |
Short-term, hand-to-mouth activity [Table 4-1] |
Sub-chronic |
| Contaminated meat products | General population, per capita adults | Ingestion of meat; long-term | Total meat intake rate [Table 11-1] |
Chronic |
| Homegrown vegetables | Home gardeners | Ingestion of home-produced vegetables; long-term | Intake of home-produced vegetables [Table 13-1] |
Chronic |
| Fish and shellfish | General population children | Ingestion of fish and shellfish | Intake of fish and shellfish [Table 10-1] |
Sub-chronic |
| Marine fish | Sport fishers | Ingestion of marine fish | Intake of marine fish [Table 10-3] |
Chronic |
| Contaminated grain products | General population, consumers only | Ingestion of grain | Intake of total grains [Table 12-1] |
Chronic |
| Human milk | Infants | Nursing during birth to 12 months | Intake of human milk [Table 15-1] |
Sub-chronic |
Several resources are available that illustrate ingestion exposure scenarios.
Factors
Data on ingestion rates are available in EPA’s Exposure Factors Handbook: 2011 Edition (Handbook) as indicated below. Exposure factors related to ingestion exposures are also described in the Media Tool Set of the EPA ExpoBox.
- Chapter 3 - Ingestion of Water and Other Liquids
- Chapter 4 - Non-Dietary Ingestion Factors
- Chapter 5 - Ingestion of Soil and Dust
- Chapters 9 through 15 - provide information on food intake, including intakes of fruits and vegetables; fish and shellfish; meats, dairy products, and fats; grain products; home-produced foods; total food; and human milk.
Water and food intake rates are typically estimated from dietary intake surveys. Water ingestion rates and food ingestion rates in Chapters 3 and 9–13 of the Handbook are provided as per capita and/or consumer-only data. Per capita rates include all survey participants whether or not they reported intake during the survey period. Consumer-only rates exclude individuals who did not ingest the water or food from the source during the survey period.
The Exposure Factors Tab of the Indirect Estimation Module provides links to data on ingestion rates.
Food and water ingestion rates can vary by type of food, source of food or water, and receptor (U.S. EPA, 2011).
- Type of food – Intake rates can be defined by individual food types, such as beef, fish, carrots, and apples, or by categories of foods, such as total vegetables, total fruits, above ground produce, or root vegetables. Another potential type of food is human milk, relevant for only one lifestage.
- Source of food – Intake can vary by the source of food. For example, the Handbook provides different intake rates for fruits and vegetables for the general population versus individuals who produce their own fruits, vegetables, and meats. Similarly, fish intake rates are presented for the general population, recreational anglers, and Native American populations.
- Source of water – Consumption rates of drinking water by source may be needed if the exposure scenario involves ingesting water a specific source (e.g., community or bottled water source).
- Receptor – Intake rates might differ across different populations. Where possible, EPA presents intake rates for different age groups, races, and ethnic groups. It is important to select exposure values that are appropriate for the particular population of concern. For example, the general population of the United States may be of interest in some assessments, but others may focus on certain subsets of the population (e.g., farmers, recreational anglers).
Mouthing behavior and soil/dust ingestion rates account for inadvertent soil/dust ingestion, particularly in children. “Hand-to-mouth” or “object-to-mouth” activities may result in incidental exposure. Adults may also be exposed by ingesting soil that adheres to food or objects that have been handled. Exposure factor data for this category include separate values for adults and children (U.S. EPA, 2011).
- Source – Ingestion rates may differ depending upon the source (e.g., indoor dust, outdoor soil).
- Soil-pica and geophagy – Inadvertent ingestion of soil should be differentiated from soil-pica and geophagy. Soil-pica is the recurrent ingestion of unusually high amounts of soil. Geophagy is the intentional ingestion of earths and may be associated with cultural practices. Soil-pica and geophagy are considered uncommon events and represent the high end of exposures.
Ingestion rates should be selected to represent the age, lifestage, gender (if appropriate), and population group (e.g., per capita, consumers only) for the exposure scenario of interest. Other exposure factors that might be needed for assessing dietary or non-dietary ingestion exposures include:
- Body weight (Chapter 8)
- Activity-specific factors (Chapter 16)
- Consumer product use information (Chapter 17)
- Life expectancy values, specifically when evaluating cancer risk (Chapter 18)
The Exposure Factors Tab of the Indirect Estimation Module provides links to data on other factors.
Guidance
The following sources provide helpful information for conducting exposure assessments involving the ingestion route of exposure.
References
- IPCS. (2004). IPCS Risk Assessment Terminology: Part 2: IPCS Glossary of Key Exposure Assessment Terminology(122 pp, 951 K, About PDF) Exit. Geneva, Switzerland: World Health Organization.
- U.S. EPA. (1992). Guidelines for Exposure Assessment. (EPA/600/Z-92/001). Washington, DC.
- U.S. EPA. (2011). Exposure Factors Handbook 2011 Edition (Final). (EPA/600/R-09/052F). Washington, DC.