Exposure Assessment Tools by Approaches - Indirect Estimation (Scenario Evaluation)
Overview
 EPA’s Guidelines for Exposure Assessment (U.S. EPA, 1992) defines scenario evaluation as
"an approach to quantifying exposure by measurement or estimation of both the amount of a substance contacted, and the frequency/duration of contact, and subsequently linking these together to estimate exposure or dose."
Scenario evaluation is an “indirect estimation” method that relies on an exposure scenario to estimate exposures or doses. An exposure scenario is a set of facts, assumptions, and inferences about how exposure takes place.
This is in contrast to Point-of-Contact approaches, which more directly measure exposures or doses, and Exposure Reconstruction, which estimates exposure using information on an effect or outcome.
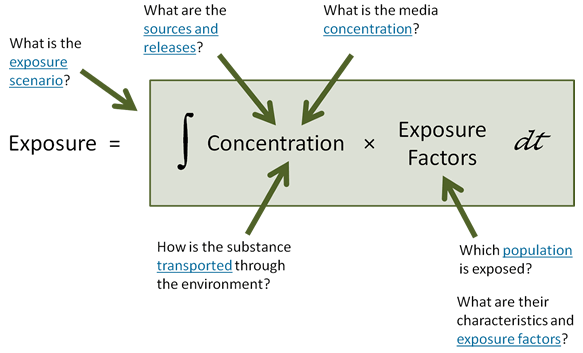
Indirect estimation of exposure or dose ultimately requires quantitative values to use as inputs to exposure/dose equations. The inputs to these equations are obtained through the development of exposure scenarios.
Exposure scenarios rely on data or assumptions about the sources and releases of a stressor of interest, fate and transport mechanisms, and concentrations of contaminants at the point of exposure. Information about receptor populations and exposure factors (e.g., activities and time frame over which exposure occurs) are also needed.
The general equation shown in the adjacent figure, and more complex integrative models can be used to quantify exposures or doses for the populations of interest. Point-of-Contact measurement approaches can be used to validate results of scenario evaluation assessments.
Indirect Estimation of Potential Dose: Example
Developing Scenarios
- Planning, Scoping, and Problem Formulation
- Exposure Setting
- Stressors of Concern
- Tailoring the Exposure Scenario
- Tools
The goal of scenario evaluation is to estimate exposure or dose by establishing exposure profiles. These profiles link concentrations of a stressor in environmental media to the frequency and duration of a receptor’s contact with those media.
The organizational construct used most often to analyze the link between source and receptor is an exposure scenario![]() exposure scenarioA set of facts, data, assumptions, inferences, and sometimes professional judgment about how exposure takes place.. Exposure scenarios provide a foundation that can be used by assessors as they:
exposure scenarioA set of facts, data, assumptions, inferences, and sometimes professional judgment about how exposure takes place.. Exposure scenarios provide a foundation that can be used by assessors as they:
- qualitatively characterize the conditions under which exposures are expected to occur;
- quantitatively estimate exposure, dose, and risk values;
- provide a context for quantitative estimates to risk managers, mainly through application of appropriate exposure and risk descriptors
 descriptorsEstimates for a specific point on the exposure distribution (e.g., mean, median, 95th percentile, maximum) for individual or population exposures.; and
 - evaluate the relative impacts of different risk management decisions.
An exposure scenario generally contains some information on the following components:
- Exposure Setting: The physical setting where exposure takes place.
- Characterization of the Stressor: Identification and characterization of stressors of concern, sources and releases, and concentrations in environmental media.
- Exposure Pathways: The pathway(s) of the stressor from source(s) to receptors(s), including its fate and transport through the environment, the routes to exposed individual(s), and the specific exposure location(s).
- Characterization of the Exposed Population: Identification of the individual(s) or population(s) exposed, and the receptor characteristics, activities, and behaviors (i.e., the exposure factor(s) that influence the frequency and duration of contact with the stressor).
- Intake and Uptake Rates: Exposure factor(s) that quantify the transfer of the stressor across biological boundaries.
Planning, Scoping, and Problem Formulation
Problem formulation is the process by which the assessor, in conjunction with risk managers and often various stakeholders, determines the purpose, scope, level of detail, and approach of an assessment.
According to EPA’s Guidelines for Exposure Assessment (U.S. EPA, 1992),
"In beginning the evaluation phase of any assessment, the assessor should have a scenario's basic assumptions (setting, scope, etc.) well identified, one or more applicable exposure pathways defined, an equation for evaluating the exposure or dose for each of those exposure pathways, and the data and information requirements pertinent to solving the equations."
To arrive at these basic assumptions, the assessor usually considers a set of basic questions about the factors influencing an exposure assessment. Some examples are presented below. Available information is compiled to inform the assessment. Generally, consultation with experts (e.g., statisticians, toxicologists) is necessary to address some of the questions in detail.
Planning, scoping, and problem formulation is often an iterative process. This step may be revisited throughout the course of the exposure assessment as new information is collected and preliminary results are obtained.
Planning, scoping, and problem formulation is often an iterative process and a step that will be revisited throughout the course of the exposure assessment as new information is collected and preliminary results are obtained.
Planning, scoping, and problem formulation is necessary to establish a clear purpose and scope of the assessment. It is used to characterize the exposure setting and stressors of concern in sufficient detail to allow quantitative analysis and modeling. It also helps to determine whether
- a scenerio evaluation approach is appropriate
- which tier or type of scenario should be developed, what descriptor is most appropriate for the scenario, and
- which routes, populations, and media should be included in the scenario
The Screening-Level and Refined Module in the Tiers and Types Tool Set of EPA ExpoBox provides additional information on the planning process and applying a tiered approach.
EPA’s Guidance on Cumulative Risk Assessment: Part 1. Planning and Scoping (1997b) notes that developing a conceptual model is a key part of the planning and scoping stage for an exposure assessment.
A conceptual model (CM) is a diagram or written description of the predicted key relationships between the predicted responses of a population (or entity of concern) and its stressors. It lays out the environmental pathways and routes of exposure in the context of the assessment.
The CM needs to distinguish between what is known or determined and what is assumed or based on default values. Also, it needs to include a discussion of uncertainties in the formulation of the assessment (U.S. EPA, 1997b).
| Purpose |
|---|
|
| Scope |
|
| Level of Detail |
|
| Approach |
|
Overarching approach questions:
Detailed approach questions:
|
Several resources are available for the process of planning, scoping, and problem formation.
Exposure Setting
An exposure setting is the physical setting where an exposure of interest occurs. It is defined by the boundaries of the analysis and the scope and geographic scale of the assessment. Data are collected on physical characteristics that will affect the movement, transformation, and persistence of contaminants within the domain of the exposure scenario.
Relevant information might include data on groundwater flow, soil type, surface water characteristics, meteorological conditions, and land use/land cover types, among others, as illustrated in the graphic below.
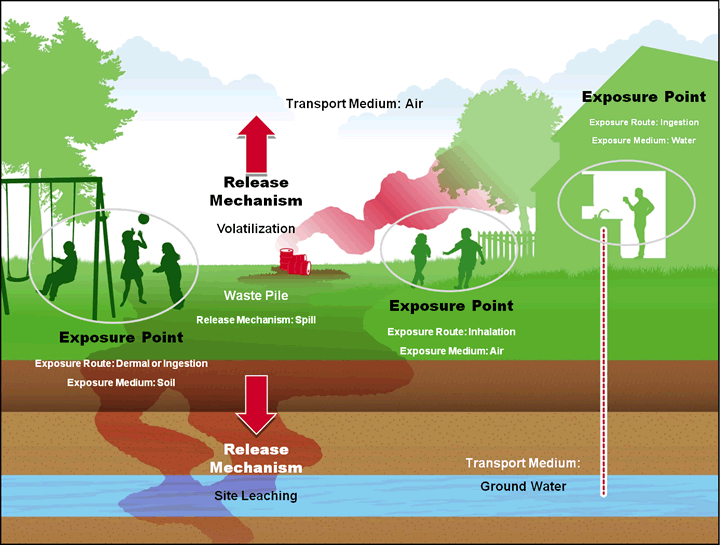 This figure depicts leaking drums as the source of contamination. Chemicals are released into the air via volatilization, soil via leakage, and water via leaching. The chemicals are transported through air and water to the receptor populations. Receptors also are exposed through direct contact with the soil.
Stressors of Concern
A stressor is any biological, chemical, or physical entity that can cause or induce an adverse response in a human or ecological receptor. Traditional risk assessment has used a single-stressor approach. However, some risk assessment tools and models that allow for the assessment of multiple stressors are now available. (See the Aggregate and Cumulative Module in the Tiers and Types Tool Set of EPA ExpoBox)
Databases and other resources are available that describe the occurrence and characteristics of single stressors, and classes of stressors (e.g., radiation, pesticides). Resources on stressors associated with specific scenarios (e.g., drinking water contaminants, household product ingredients) might also be of interest to assessors.
These resources generally include available data on the physicochemical properties that affect the transport, transformation, and fate of stressors in environmental media. They may also include data on properties that are relevant to the toxicological potential of the stressor. Regulatory agencies also derive exposure levels for various stressors based on human health or ecological effects, and these values can be found in a variety of databases.
Considerations involved with developing exposure scenarios for specific chemical classes are described in the Chemical Classes Tool Set of EPA ExpoBox.
Tailoring the Exposure Scenario
There are a number of ways to tailor an exposure scenario to focus on a specific tier or type of analysis, exposure route, exposed population, exposure medium, or chemical class. The methods and resources available for tailoring an exposure scenario in these different areas are described in the other Tool Sets available in EPA ExpoBox:
- Tiers and Types. Exposure scenarios can be developed to support different tiers and types of exposure assessments. Individual "tiers" correspond to iteratively more complex, and typically data-intensive, steps in the assessment. At each stage of a tiered exposure assessment, investigators evaluate whether the assessment results are sufficient to support the risk management decisions. The type of assessment might refer to whether the assessment is considering aggregate or cumulative exposures or whether is at the individual or population level.
- Exposure Routes. Exposure scenarios can be developed to focus on either one or many routes of exposure. The routes of exposure for which environmental exposure scenarios are commonly developed are inhalation, ingestion, and dermal contact.
- Exposure Media. Exposure scenarios can evaluate releases of stressors to a specific media, movement within media, and potential for contact with a receptor. Typical media compartments include air, water and sediment, soil and dust, food, aquatic biota, and consumer products.
- Exposed Populations. Exposure scenarios can be developed for one or more individuals within a population or a population as a whole. Some scenarios are developed to estimate general population exposures. Others focus on specific population segments such as residential, consumer, occupational, and highly exposed populations.
Tools
Sources and Releases
People can be exposed to stressors in the air they breathe, food they eat, water they drink, and products they use or contact. Sources of stressors can be places, objects, activities, or entities that release chemicals (e.g., automobile, pesticide application). Typically, the source is defined as the origin of an agent, or stressor, for the purposes of an exposure assessment.
When a substance is released from a source, it is subject to transport and transformation in the environment. Fate and transport processes "link" the source and release of substances with the resultant environmental concentrations to which people can be exposed.
Environmental monitoring can provide information on release rates and environmental concentrations of a stressor. It can also assist in evaluating source/stressor formation and fate and transport. Monitoring data can be used with environmental fate and transport models to characterize media-specific exposure concentrations.
Monitoring data are not always available. For some exposure assessments, data on sources and releases include quantitative information about emission rates of chemicals. These data are available in emission inventories maintained by government agencies, in facility-specific records, or via direct measurement at the site of release. Emission rates can also be estimated using emission factors.
Sources release a substance into a receiving medium (e.g., air, water). However, that initial receiving media compartment can subsequently serve as a source by releasing into other media. In other words, environmental media can serve as both sources and receiving media.
Data are collected to characterize the rate of release of agents into the environment from a source of emission such as an incinerator, landfill, industrial or municipal facility, or consumer product. Databases and other resources are available that identify common sources of stressors in the environment and quantify their releases to and from air, water, soil/sediment, food, biota, and consumer products.
Fate and Transport
Fate and transport covers movement of substances in the environment and chemical/biological reactions that affect the nature of the substance. The figure below shows some transport processes that might occur following release of a contaminant.
Transport: Movement Within and Between Environmental Media
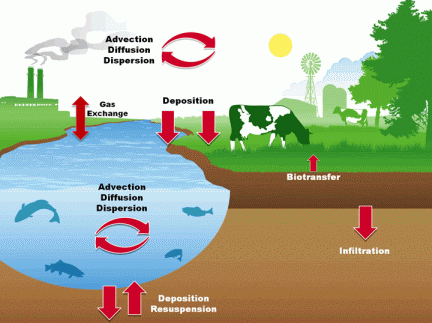
Transport can occur within a medium. For example, in the figure, a chemical released to the air is shown moving away from the stack via advective, dispersive, and diffusive processes. These same processes might also occur in the surface water.
Transport can also happen at the interface between two environmental media. For example, chemicals present in the air as vapors or absorbed into particles can be transferred into the soil via a range of different processes occurring at and across the air-soil interface.
Transport of chemicals can also occur between abiotic and biotic media. In other words, people and wildlife, as part of the environment, can be exposed to chemicals released initially to abiotic environmental media (Thibodeaux, 1996).
The other part of "fate and transport" is chemical transformation of a contaminant in the environment. This is typically assumed to occur within a medium. Some of the types of transformations that can occur in the environment are shown in the figure below.
Transformation: Chemical Changes within a Medium
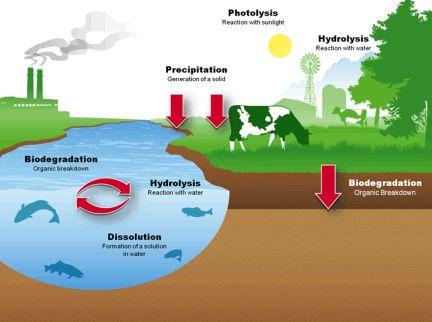
Once released into the environment, the form and distribution of stressors among various media or environmental compartments can be affected by the physical and chemical properties of the stressor (e.g., water solubility, vapor pressure, partitioning).
Characteristics of the environment can also impact fate and transport. Some categories of characteristics that can influence stressor fate and transport include:
- Soil and sediment properties, such as particle size and porosity
- Climate and meteorology, which cover properties like wind speed, evaporation rate, and rainfall amount
- Surface water and groundwater properties, including flow, temperature, and pH
- Other properties of the ecosystem, including microbial populations, topography, and indigenous species
The specific influences that environmental characteristics can have on stressors’ fate and transport patterns are widely varied. In exposure assessments, fate and transport of stressors is typically evaluated via some level of modeling. Modeling applies mathematical representations to the processes that distribute and transform stressors in the environment.
Resources are available that provide information on physicochemical properties that affect fate and transport. Other resources provide tools for evaluation of fate and transport based on media type.
Concentrations
As described in the EPA’s Guidelines for Exposure Assessment (U.S. EPA, 1992), exposure is dependent upon the intensity, frequency, and duration of contact. Exposure magnitude is usually expressed as the concentration of contaminant per unit mass or volume (e.g., μg/g, μg/L, mg/m3, ppm) within the environmental media to which exposure occurs.
Characterizing contaminant concentrations for an exposure scenario is typically accomplished using one or more of the following approaches:
- Sampling the bulk media with which the receptor is expected to come into contact and analyzing the media to measure contaminant concentration
- Using existing, available measured concentration data collected for related analysis or compiled in databases
- Modeling the concentration distribution based on source characteristics, media transport, and chemical transformation processes (i.e., modeling fate and transport)
Methods for Determining Contaminant Concentrations
Stressor concentrations are typically measured or estimated in air, water, soil, food or food webs, microenvironments, surfaces, biota, or a combination of any of these.
Environmental concentrations or exposures can be measured directly through media sampling or monitoring and analysis, or indirectly estimated using models. A common approach for quantifying exposure for risk assessment is to combine the use of environmental monitoring data with model outputs. This approach integrates measured concentrations, and the effects of fate and transport processes.
Depending on the assessment, the modeling approach can be characterized in multiple ways including:
Mechanistic (i.e., based on theories of physical processes)
OR
Empirical (i.e., based on observed experimental data)
Deterministic (i.e., uses set of single point values)
OR
Probabilistic (i.e., uses distribution of point values from which single point values are selected randomly)
Steady-state (i.e., variables are assumed to stay the same over time)
OR
Dynamic (i.e., variables are assumed to change over time)
Further, the fate and transport processes might be modeled based on one or more of these approaches:
- First principles – model is based only on established scientific laws and principles; no assumptions are employed.
- Partitioning – model is based on how transport and transformation phenomena influence the distribution of the substance in the environment.
- Mixing – model is based on identifying features in mixtures that allow stressors to be quantified by source.
- Bioaccumulation – model is based on the varying abilities of biological organisms to accumulate stressors over time at concentrations higher than those to which they are exposed.
Many resources are available describing modeling techniques, sampling techniques, and analytical methods employed for estimating or measuring media concentrations in air, water and sediment, soil and dust, food, aquatic biota, and consumer products.
Characterizing Populations
Exposure can vary across populations. Differences in age, gender, dietary preferences, occupation, cultural practices, geographical locations and settings may affect exposures.Certain behaviors, activities, or sociodemographic factors may also be associated with differences in contact with environmental agents.
For example, infants might experience higher exposures to certain types of contaminants than adults because of mouthing behaviors that increase the likelihood of ingesting soil or dust. Older adults may be more affected by exposures to other types of environmental agents because of physiological differences associated with age.
Individuals living in buildings in disrepair (e.g., with peeling paint) might have higher exposure to certain types of contaminants (e.g., lead, particulate matter, vehicle exhaust) than individuals in other settings. See the Lifestages and Populations Tool Set of EPA ExpoBox for additional information and resources on assessing exposure to specific groups (e.g., tribes/ethnic populations, workers) and lifestages (e.g., children, older adults).
EPA’s Guidelines for Exposure Assessment (U.S. EPA, 1992) suggest that it is often helpful for risk assessors to characterize and quantify the magnitude of risk for specific highly exposed, highly sensitive, or highly susceptible subgroups within the larger population. Considering vulnerability and susceptibility is critical to protect those populations at greatest risk when making risk management decisions.
Identifying Highly Exposed Populations
U.S. EPA’s Sociodemographic Data Used for Identifying Potentially Highly Exposed Populations (U.S. EPA, 1999b) provides guidance to help risk and exposure assessors identify and enumerate populations that may potentially experience greater contact with environmental contaminants due to unique activity patterns, preferences, behaviors and various sociodemographic.
The tables below provide information to help assessors enumerate populations, based on a variety of population characteristics. The intent is to provide data for selected populations of concern in common potential exposure scenarios—not for every possible population group.
In some cases, these resources can be used directly to quantify a population of interest (e.g., U.S. Census Bureau data on the number of individuals in a certain age group). In other cases, the resources can be used to help characterize potential exposure for a population in a certain category (e.g., the number of homes built before 1978 might serve as a surrogate for estimating the number of people potentially exposed to lead paint).
Tools for estimating exposure among specific population groups (e.g., tribes/ethnic populations, workers) and lifestages (e.g., children, older adults) can be found in the Lifestages and Populations Tool Set of EPA ExpoBox.
Exposure Factors
Exposure factors are factors related to human behavior and characteristics that help determine an individual's exposure to an agent. These factors include, rates of ingestion (e.g., foods, soil, water) or inhalation, factors affecting dermal exposure (e.g., skin surface area, soil-to-skin adherence), activity factors (e.g., time spent indoors, time spent showering, etc.), or other factors (e.g., body weight, consumer products use).
The main source of exposure factors data is EPA’s Exposure Factors Handbook: 2011 Edition (U.S. EPA, 2011a). Information from the Exposure Factors Handbook: 2011 Edition and data and resources used in developing the recommendations provided in the Handbook may be accessed using the links in the tables below.
A summary of the recommended values is provided in spreadsheet format (XLS) (1 pp, 77 K). It is important to note that these recommendations are not legally binding on any U.S. EPA program and should be interpreted as suggestions that program offices or individual exposure assessors can consider and modify as needed.
Tables from the handbook can be identified from the EPA ExpoBox's Exposure Factor Tables Search. A selected number of these tables are available in spreadsheet format. These tables were selected because they contain distributional information that may be suitable for probabilistic analyses.
ExpoFIRST is a standalone tool that draws from data in the EPA’s Exposure Factors Handbook for quick, easy, and flexible development of human exposure scenarios. The tool develops these scenarios based on the selections made by the user in terms of the route of exposure, media, exposure descriptor, receptor (age groups) and other demographic and/or activity-related factors.
You will need Adobe Reader to view some of the files on this page. See EPA’s About PDF page to learn more.
There are similar efforts in other countries that provide data on exposure factors. For example, the European Union developed the ExpoFacts database Exit which contains data from 30 European countries. Likewise, Japan developed the Japanese Exposure Factors Handbook Exit and Australia developed the Australian Exposure Factor Guide (PDF) (87 pp, 4.45 MB) Exit; these resources provide data specific to each country’s population.
Full List of Exposure Factors
| Inhalation | Highlight | Full Detail | Spreadsheets | Related links |
|---|---|---|---|---|
| Inhalation rates |
| Dermal | Highlight | Full Detail | Spreadsheets | Related links |
|---|---|---|---|---|
| Surface area, soil to skin adherence, and other factors |
Calculating Exposure and Dose
Methods
Approaches for quantifying exposure vary depending on the level of refinement or complexity required. Directly related to the level of refinement incorporated into an assessment is whether the results of the assessment are a point estimate or a distribution of possible values.
- Deterministic exposure assessments use point estimates (or, single values) to quantify the amount of exposure that is likely to occur for potential receptors. They produce exposure estimates that are also point estimates and can provide an estimate of central tendency
 central tendencyCentral tendency estimates generally represents the average or typical individual in a population, usually the mean or median of the population distribution. or high-end
 high-endHigh-end estimates of exposure are generally considered to be greater than the 90th percentile of all individuals in a defined population, but less than the exposure at the highest percentile in that population. exposures within a defined population.
 - Probabilistic exposure assessment approaches use distributions of data for various parameters to generate a distribution of possible exposure estimates. Probability distributions describe the range of values (probability) that those values might occur in the given population (U.S. EPA, 2001). A widely-used approach to estimating exposure with probability distributions is the Monte Carlo simulation.
- Aggregate exposure assessment considers combined exposures to a single chemical across multiple routes and multiple pathways. Aggregate exposure assessments often include a summation of all potential exposure pathways. This is a conservative, health-protective approach that assumes that a single person will be exposed to the chemical through all possible exposure pathways (U.S. EPA, 2002).
- Cumulative exposure assessment is the evaluation of multiple stressors and multiple exposure pathways. The aim of this approach is to assess the overall impact on human health of multiple chemicals that act by a common mechanism of toxicity.
The Tiers and Types Tool Set provides further discussion and links to resources related to these methods.
Exposure Descriptors
Exposure descriptors are estimates for a specific point on the exposure distribution (e.g., mean, median, 95th percentile, maximum). Exposures vary due to differences among individuals, populations, spatial and temporal scales, and other factors.
According to U.S. EPA’s (2004) Example Exposure Scenarios,
"variability can be addressed by estimating exposure for the various descriptors of exposure (i.e., central tendency, high-end, or bounding) to estimate points on the distribution of exposure."
Exposure descriptors are useful when characterizing exposure and can help exposure assessors communicate with risk managers.
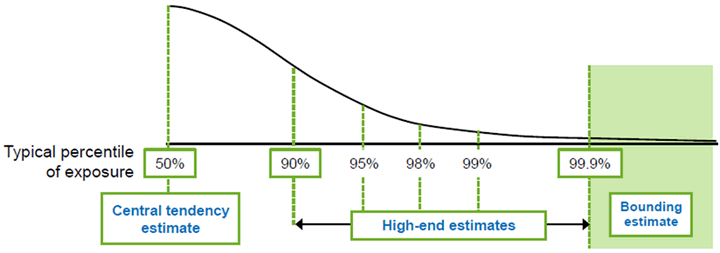 Exposure Descriptors. Source: (U.S. EPA, 1992)
Bounding Estimates
Exposure scenarios can be developed to derive a bounding estimate that captures the highest possible exposure, or theoretical upper bound, for a given exposure pathway. Bounding estimates are often used to perform screening-level assessments. If the highest possible exposure is evaluated and found to be not of concern, other potential lower exposures will also not be of concern.
Upper percentile values are selected for the key input parameters to the exposure or dose equation. The combination of these assumptions results in a highly conservative exposure estimate.
The scenarios developed for bounding estimates are sometimes referred to as “worst case” scenarios in which
“everything that can plausibly happen to maximize exposure, dose, or risk does in fact happen. This worst case may occur (or even be observed) in a given population, but since it is usually a very unlikely set of circumstances, in most cases, a worst-case estimate will be somewhat higher than occurs in a specific population” (U.S. EPA, 1992)
High-End Estimates
Exposure scenarios can be developed to derive high-end estimates of exposure. These are generally considered to be more realistic or more likely to occur compared with bounding estimates. They are often calculated using a combination of high and central inputs for exposure parameters. High-end estimates of exposure are, by definition, intended to fall within the actual distribution, rather than above it. Estimates above the distribution are bounding estimates (U.S. EPA, 1992).
The following descriptors all account for individuals at the high end of the exposure distribution (at or above the 90th percentile):
- Reasonable maximum exposure (RME) – the highest exposure reasonably likely to occur, generally assumed to be in the range of the 90th and 99.9th percentiles (U.S. EPA, 2001)
- Reasonable worst-case exposure – the lower part of the high-end exposure range, which is above the 90th percentile but below the 98th percentile (U.S. EPA, 1992)
- Maximum exposure – the range above the 98th percentile (U.S. EPA, 1992)
These terms all refer to exposures that are within the population distribution and not outside the distribution. The terms are expected to describe "an individual who exists, or is thought to exist, in the population." The worst-case scenario, by contrast, describes a situation of exposure that is "a statistical possibility that may or may not occur in the population" (U.S. EPA, 1992).
As the exposure estimate moves higher within the percentile range, the level of uncertainty increases. These high-end estimates are intended to assess exposures that are higher than average, but still within a realistic, reasonable anticipated range.
Central Tendency Estimates
Exposure scenarios can be developed to derive a central tendency estimate that represents the exposure of the average or typical individual in a population, usually the mean or median of the population distribution.
The arithmetic mean uses average values for all of the factors that comprise the exposure of interest. This value may not necessarily be representative of a single receptor or group, but it falls within the actual distribution and is useful for characterizing exposure for the average population. This value is sometimes called the "average estimate," but terminology varies from assessment to assessment.
The median is another useful descriptor of central tendency, especially when data on the receptor or exposure of interest are skewed as they are in a log normal distribution. This is often called the "typical case," but terminology can vary.
If both the arithmetic mean and median exposure estimates are available, but vary substantially from each other, it is useful to provide both values to risk assessors to provide greater context about the exposure scenario and resulting exposure estimates.
Tools
A variety of tools are available for calculating the doses of contaminants to which populations may be exposed. These tools have typically been developed for specific situations or programs but may be tailored to meet the needs of the user.
Also see the Routes Tool Set for information and tools on calculating dose.
References
- Thibodeaux, LJ. (1996). Environmental Chemodynamics (2 ed.). New York: John Wiley & Sons.
- U.S. EPA. (1992). Guidelines for Exposure Assessment. (EPA/600/Z-92/001). Washington, DC.
- U.S. EPA. (1997a). Exposure Factors Handbook. (EPA/600/P-95/002Fa-c). Washington, DC.
- U.S. EPA. (1997b). Guidance on Cumulative Risk Assessment, Part 1 Planning and Scoping. Washington, DC.
- U.S. EPA. (1999a). Risk Assessment Guidance for Superfund (RAGS): Volume I - Human Health Evaluation Manual, Supplement to Part A: Community Involvement in Superfund Risk Assessments. (EPA/540-R-98-042). Washington, DC.
- U.S. EPA. (1999b). Sociodemographic Data Used for Identifying Potentially Highly Exposed Populations. (EPA/600/R-99/060). Washington, DC.
- U.S. EPA. (2001). Risk Assessment Guidance for Superfund: Volume III - Part A, Process for Conducting Probabilistic Risk Assessment. (EPA 540-R-02-002). Washington, DC.
- U.S. EPA. (2002). Guidance on Cumulative Risk Assessment of Pesticide Chemicals that have a Common Mechanism of Toxicity. Washington, DC.
- U.S. EPA. (2004). Example Exposure Scenarios Assessment Tool. (EPA 600/R03/036). Washington, DC.
- U.S. EPA. (2008). Child-Specific Exposure Factors Handbook. (EPA/600/R-06/096F). Washington, DC.
- U.S. EPA. (2009). Highlights of the Child-Specific Exposure Factors Handbook. (EPA/600/R-08/135). Washington, DC.
- U.S. EPA. (2011a). Exposure Factors Handbook: 2011 Edition (EPA/600/R-09/052F). Washington, DC.
- U.S. EPA. (2011b). Highlights of the Exposure Factors Handbook. (EPA/600/R-10/030). Washington, DC.


