Using BMDS Wizard to Evaluate Continuous Datasets
As with the previous dichotomous dataset exercises, these exercises employ BMDS Wizard to analyze continuous datasets. This page will walk you through three sets of continuous dataset exercises. (You can also use Benchmark Dose Software (BMDS) for these Continuous exercises, by using the same techniques illustrated in the Dichotomous exercise.)
The BMDS Wizard includes two continuous worksheets: one preformatted for Standard Deviation (continuous StDev.xlsm) and one for Relative Deviation (continuous RelDev.xlsm). For these exercises, use the standard deviation worksheet.
Refer to the online training for deeper information on continuous BMD model concepts and the technical guidance document for specific guidelines on continuous models.
Prerequisites
- Copied the continuous-StDev template to a directory that will hold all of your BMDS Wizard modeling spreadsheets. (Described in the BMDS Wizard User's Reference Guide, Section 1.2.1)
- Renamed the spreadsheet and placed it in a new folder or path. (Section 2.1)
- Ensured macros are enabled in the spreadsheet. (Section 1.2.4)
Exercise 1
- Open a copy of the BMDS Wizard continuous-StDev worksheet file and save it to your working directory.
- On the Startup tab, click the Main Page button. The Main worksheet tab is displayed.
- On the Main Page, fill in the Study and Year as “Exercise_1_cont.” Use the Select Folder buttons to navigate to and specify the BMDS Installation Directory and the Output File Directory. You can specify data for the Study and Modeling Inputs boxes, but it’s not necessary for this exercise.
- Click the cell in C20 to move to the Data worksheet.
- Enter the numbers from the following table into the Data worksheet. The quick way: copy the rows of numbers below and paste them into the Data worksheet starting at the Dose Group 1 row. After you’ve pasted in the data, BMDS Wizard reports that the data trend is increasing.
Dose NumAnimals MeanResponse StDev 0 10 1.61 0.12 35 10 1.66 0.13 105 10 1.75 0.11 316 10 1.81 0.15 625 10 1.89 0.13 - Click Return to Main to display the Main Page. Note that BMDS Wizard has loaded the appropriate models based on the number of dose groups.

From the BMDS Wizard User’s Guide:
“CV” means “constant variance model” for continuous models and “NCV” means “non-constant variance model” (or modeled-variance). These options can be changed but are pre-populated as both models are frequently run simultaneously.
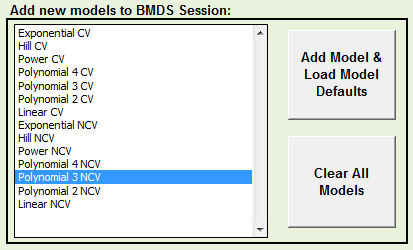
- Depending on your version of the BMDS Wizard continuous-StDev worksheet file, the Exponential 3, 4, and 5 models may not be enabled for the Exponential CV and Exponential NCV columns. To ensure these models are enabled for a complete test run, do the following:
On the worksheet’s Main tab, scroll down to the BMDS Model Option Setups section and check if the Exponential CV column’s values for the model parameters match the following screenshot: The correct value for all of these parameters should be TRUE.If they are, proceed to the next step. If they are not, click a cell to display a down-pointing arrow, click the arrow to display a picklist, and select TRUE. When complete, the cells should now look like this:
 You must also edit the Exponential NCV column cells so that their values for these parameters are also TRUE.
 -
Click the AUTORUN button. For this exercise, the operations should take less than 30 seconds. The BMDS Wizard automatically displays the Results tab when the session is done. Your results should resemble the following screenshot.

-
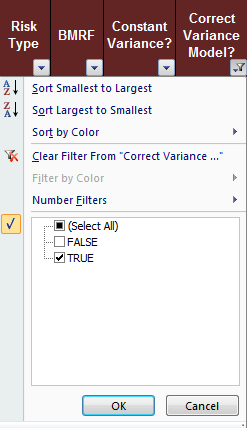
Note the Correct Variance Model? column’s picklist button, which shows the Excel Filter icon. With the filter set to TRUE, only the results based on the true (preferred) variance model will display. The results are based on p-value Test 2 and 3 results. The p-value Tests 2 and 3 test whether BMDS has modeled the observed variances correctly. Test 2 reports whether or not the observed variances are constant or not, and test 3 reports whether the user has parameterized the model correctly to appropriately describe the observed variances.
 However, you may find it useful sometimes to review all results. Click the Filter arrow to display the Filter picklist, as shown below.
-
Tick the FALSE checkbox to include both TRUE and FALSE results and click OK. The spreadsheet now displays results for all models.

- The column “BMDS Wizard Recommendation” highlights the cell for the recommended model. For the recommended model, click its cell in the “Include in Summary Table?” column. From the picklist for that cell, choose “Select.” All models marked “Include” will be printed in the summary table report.
- At the top of the sheet is a field labeled “Basis for Model Selection.” Enter a justification for choosing the model. The justification will be included in the Microsoft Word-based summary report.
For the justification, you can type in your own text or click the triangle to the right of “Basis for Model Selection” text field to select sample text you can modify.
Refer to Section 2.8, “Viewing BMDS Wizard Recommendations and Selecting a Best-Fitting Model,” of the BMDS Wizard User’s Guide for more information and considerations.
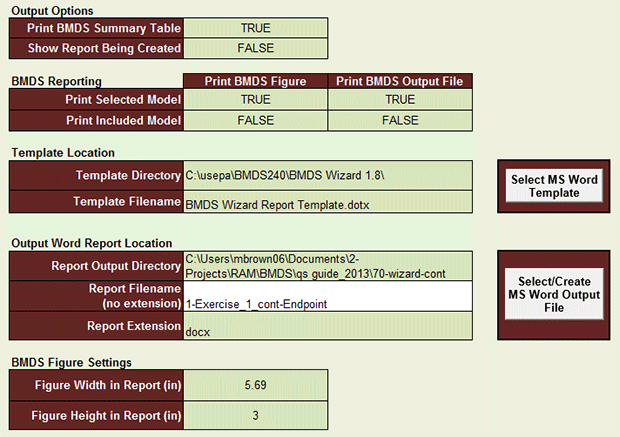
- To generate summary tables and reports, click on the Report tab. The BMDS Wizard can generate a Microsoft Word report based on the EPA Integrated Risk Information System (IRIS) template for a benchmark dose appendix.
- Select TRUE or FALSE to specify the items you want included in the report.
- Click the Select MS Word Template button to specify the folder containing the report template (in a default BMDS installation, this will be the BMDS Wizard program directory).
- Click the Select/Create MS Word Output File button to select the report’s path and file name.

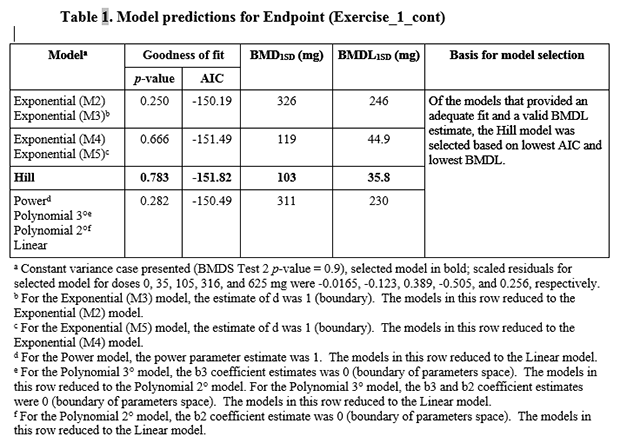
- Click the Print Word Report button. The Wizard will generate and display the report. The report you generate from this exercise should resemble the one shown below. Refer to Section 2.9, “Generating Summary Tables and Reports,” of the BMDS Wizard User’s Reference Guide for more information on generating and modifying reports.

Questions
- Using the results returned from the sample data you entered, which model would you select and why?
Select the Hill model based on lowest Akaike Information Criteria
 Akaike Information CriteriaA statistical procedure that provides a measure of the goodness-of-fit of a dose-response model to a set of data. AIC = -2 x (LL - p), where LL is the log-likelihood at the maximum likelihood fit, and p is the degrees of freedom of the model (usually, the number of parameters estimated). (AIC) and lowest BMDL
 BMDLA lower one-sided confidence limit on the BMD..
- For the “Unusable” models, why are they unusable?
BMDS Wizard conducts several dataset tests to determine a model’s viability. A model is categorized as “Unusable” due to:
- Invalid BMDL
- Invalid BMD
- Invalid AIC
- Wrong variance model (based on p-test 2) (continuous datasets only)
- Poorly modeled variance (p-test 3 < 0.1) (continuous datasets only)
For more information on the BMDS Wizard decision logic, refer to Section 2.5, “Modifying Decision Logic,” of the BMDS Wizard User’s Reference Guide.
Exercise 2
Before starting this exercise, create four new continuous-StDev files: two endpoints for males and two endpoints for females. Ensure you’ve done the prerequisites listed at the top of this page before beginning work in each file.
For this exercise, you will model the endpoints from the following tables.
| Parameter | 0 ppm | 500 ppm | 1000 ppm | 2000 ppm |
|---|---|---|---|---|
| Number of animals | 12 | 11 | 12 | 12 |
| Brain weight (g) | 1.99 ± 0.06 | 1.98 ± 0.09 | 1.88 ± 0.08* | 1.74 ± 0.05** |
| Cerebellum weight (g) | 0.295 ± 0.019 | 0.294 ± 0.014 | 0.283 ± 0.017 | 0.246 ± 0.019** |
| Parameter | 0 ppm | 500 ppm | 1000 ppm | 2000 ppm |
|---|---|---|---|---|
| Number of animals | 12 | 12 | 12 | 12 |
| Brain weight (g) | 1.85 ± 0.05 | 1.83 ± 0.07 | 1.80 ± 0.06 | 1.67 ± 0.06** |
| Cerebellum weight (g) | 0.270 ± 0.013 | 0.264 ± 0.011 | 0.258 ± 0.019 | 0.227 ± 0.014** |
** p = .01

- Create and save a separate BMDS Wizard file
- Run all appropriate models with BMR
 BMRThe response, generally expressed as in excess of background (see for example, Extra Risk), at which a benchmark dose or concentration is desired (see Benchmark Dose, Benchmark Concentration). = 1 SD. Check to ensure that Row 59 (“BMRF") on the Main tab is set to 1.
 - Analyze and interpret results on Results worksheet
- Export results (with the chosen model Selected) to a Word Report.
Question
- Which model would you choose for each endpoint and why?
- Male, brain weight: Exponential Model 3, lowest AIC
- Male, cerebellum weight: Polynomial 2nd degree, lowest AIC
- Female, brain weight: Polynomial 3rd degree, lowest AIC
- Female, cerebellum weight: Polynomial 3rd degree model, lowest AIC
Exercise 3
Below is a table from an NTP chronic inhalation study of rats reporting hematological effects in females.
Note that the means are standard deviation (SD) and not standard error from the mean (SEM). Using the wrong means can lead to erroneous BMD analyses.
| Chamber Control | N | 31 ppm | 62.5 ppm | 125 ppm | 250 ppm | 500 ppm | |
|---|---|---|---|---|---|---|---|
| Erythrocytes (10E6/μL) |
8.48 ± 0.05 | 10 | 8.08 ± 0.07** | 7.70 ± 0.08** | 6.91 ± 0.05** | 6.07 ± 0.04** | 4.77 ± 0.15** |
| Retriculocytes (10E6/μL) |
0.086 ± 0.05 | 10 | 0.10 ± 0.06 | 0.16 ± 0.05 | 0.26 ± 0.07* | 0.34 ± 0.08** | Data not available |
** p = 0.01
Model both endpoints, paying particular attention to the polynomial model results.
Questions
- Assume that no consensus could be reached regarding the level of change in these endpoints that would constitute adversity. What BMDL would you use as your point of departure?
When there is no consensus as to what constitutes an adverse response for a particular endpoint, a BMR of a change in the mean equal to one control standard deviation from the control mean is recommended as a standard reporting level.
- Would you consider dropping high doses to make the model fit? Why or why not?
In some cases, you may want to consider dropping high doses to achieve adequate model fit. Note, however, that dropping high doses should be done carefully. According to the Benchmark Dose Technical Guidance, dropping the highest dose “carries with it the loss of degrees of freedom and the concomitant loss in variety of suitable models. Also, note that dropping high (and intermediate) doses when fitting models for continuous endpoints may result in a loss of information for modeling the variances.” Example A.3 in Appendix A of the technical guidance includes an example of this approach for a continuous endpoint.
