BMDS Wizard Basics and Using BMDS Wizard to Evaluate Dichotomous Datasets
The previous exercise showed you how to evaluate a simple dichotomous dataset using BMDS. This exercise walks you through how to perform the same analysis using BMDS Wizard. This exercise also demonstrates various features and functions of the BMDS Wizard interface, including running the models and printing a summary report.
Refer to the online training for deeper information on dichotomous BMD model concepts and the technical guidance document for specific guidelines on selecting and reporting dichotomous data.
Prerequisites
- Copied the dichotomous template to a directory that will hold all of your BMDS Wizard modeling spreadsheets. (Described in the BMDS Wizard User's Reference Guide, Section 1.2.1)
- Renamed the spreadsheet and placed it in a new folder or path. (Section 2.1)
- Ensured macros are enabled in the spreadsheet. (Section 1.2.4)
Exercise 1
- Open the dichotomous worksheet file.
- On the Startup tab, click the Main Page button. The Main worksheet tab is displayed.
- On the Main Page, click the 1) Setup Instructions button for information on what you will do to create a session.
- On the Main Page, fill in the Study and Year as “Exercise_1.” Use the Select Folder buttons to navigate to and specify the BMDS Installation Directory and the Output File Directory. You can specify data for the Study and Modeling Inputs boxes, but it’s not necessary for this exercise. Use the Select Folder buttons to navigate to the directories.
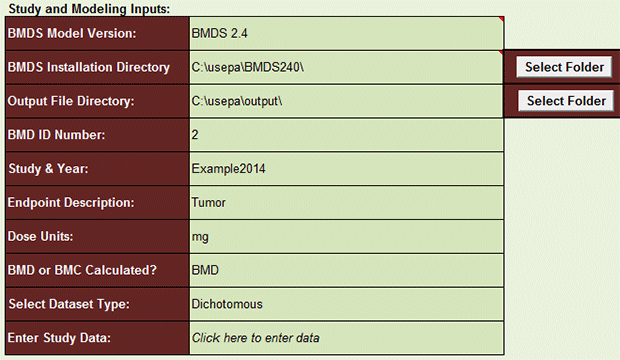
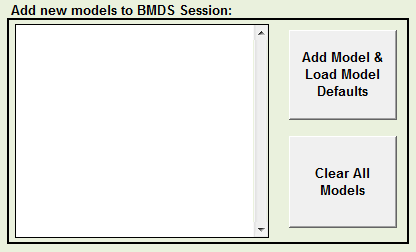
- Note that the box labeled “Add new models to BMDS Session,” which is below these cells, is empty.
- Click the cell in C20 (“Click here to enter data”) to move to the Data worksheet.
- At the Data worksheet, enter the numbers from the following table into the Data worksheet. (This is the same data that you entered for the BMDS dataset exercise.) The quick way: copy the rows of numbers below and paste them into the Data worksheet starting at the Dose Group 1 row.
Dose N Effect 0 50 0 1000 50 2 3000 50 6 8000 50 25 - The three pre-defined columns are required; however, you can edit the labels that will appear in the output. Edit the cells in the “Column Name in BMDS” row so they read “Dose,” “N,” and “Response.”
- Click Return to Main to display the Main Page. Pay attention to the following items:
- Note that the box labeled “Add new models to BMDS Session” is now populated with BMDS models. Only those models that are compatible with the dose-response group you’re using will be modeled by BMDS. The most likely models to include in the BMDS session will be displayed in the BMDS Model Option Setups area of the worksheet.
- In BMDS, you had to manually change parameters to generate 1st, 2nd, and 3rd degree multistage. But the BMDS Wizard includes all three.
- Note the BMDS Model Option Setups section where you can tweak model parameters. These rows display parameters for the models that are compatible with the data you entered. Although we will not alter any parameters for this exercise, this would be where you could change values for Risk Type, BMRF, Confidence Level, etc. (In BMDS, you would set some of these parameters in the Model Options dialog.) The Wizard color-coding legend describes which cells can be edited and which should be left as-is. Light-green cells are generally for user-input.
- Scroll back to the top of the Main Page. Click the AUTORUN button. In the background, the Wizard creates all of the input files, runs them in a BMDS session, and then imports the BMDS results into the Wizard’s Results tab. The Wizard reports its progress in the status bar at the bottom of the Excel window. For this exercise, the operations should take less than 30 seconds. (Refer to Section 2.6 of the BMDS Wizard User’s Guide for more information.)
- The BMDS Wizard automatically displays the Results tab when the session is done. Note the following tips about the Results display.
- Each row is the output for one model option file specified on the Main Page. (Refer to Section 2.7 “Viewing Imported Results” of the BMDS Wizard User’s Guide for more information.)
- Hover the mouse over each cell in the Model Type column to see a graph of the model result.
- Click the View Output Images button to display the Output tab, which shows all the result graphs. Click the Results tab to return to the Results display.
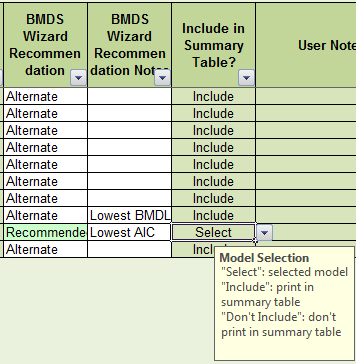
- The column “BMDS Wizard Recommendation” highlights the cell for the recommended model.
- For the recommended model, click its cell in the “Include in Summary Table?” column. From the picklist for that cell, choose “Select.” All models marked “Include” will be printed in the summary table report.
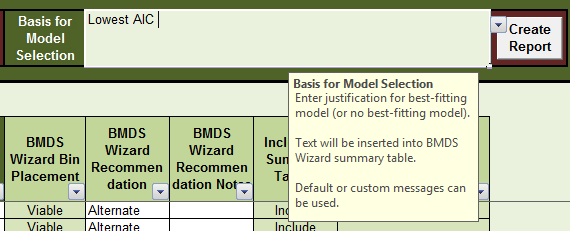
- At the top of the sheet is a field labeled “Basis for Model Selection.” Enter a justification for choosing the model. The justification will be included in the Microsoft Word-based summary report.
- For the justification, you can type in your own text or click the triangle to the right of “Basis for Model Selection” text field to select sample text you can modify.
- Refer to Section 2.8, “Viewing BMDS Wizard Recommendations and Selecting a Best-Fitting Model,” of the BMDS Wizard User’s Guide for more information and considerations.
- To generate summary tables and reports, click on the Report tab. The BMDS Wizard can generate a Microsoft Word report based on the EPA Integrated Risk Information System (IRIS) template for a benchmark dose appendix.
- Select TRUE or FALSE to specify the items you want included in the report.
- Click the Select MS Word Template button to specify the folder containing the report template (in a default BMDS installation, this will be the BMDS Wizard program directory).
- Click the Select/Create MS Word Output File button to select the report’s path and file name.
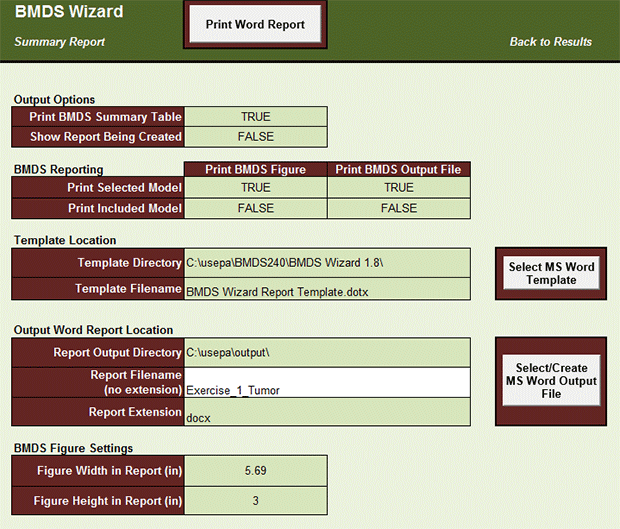
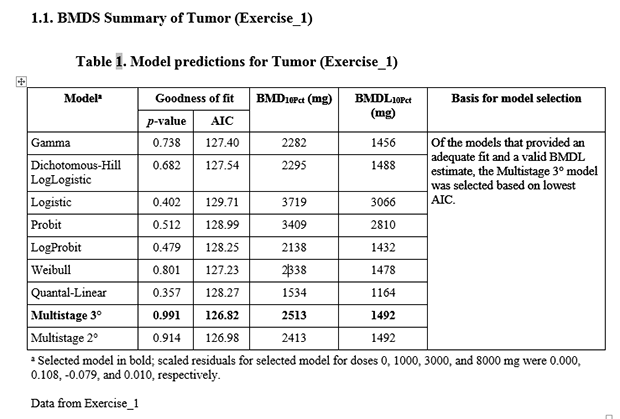
- Click the Print Word Report button. The Wizard will generate and display the report. The report you generate from this exercise should resemble the one shown below. Refer to Section 2.9, “Generating Summary Tables and Reports,” of the BMDS Wizard User’s Guide for more information on generating and modifying reports.
Questions
Using the results returned from the sample data you entered, answer the following questions on the Akaike Information Criteria![]() Akaike Information CriteriaA statistical procedure that provides a measure of the goodness-of-fit of a dose-response model to a set of data. AIC = -2 x (LL - p), where LL is the log-likelihood at the maximum likelihood fit, and p is the degrees of freedom of the model (usually, the number of parameters estimated). (AIC) and BMDL
Akaike Information CriteriaA statistical procedure that provides a measure of the goodness-of-fit of a dose-response model to a set of data. AIC = -2 x (LL - p), where LL is the log-likelihood at the maximum likelihood fit, and p is the degrees of freedom of the model (usually, the number of parameters estimated). (AIC) and BMDL![]() BMDLA lower one-sided confidence limit on the BMD. values.
BMDLA lower one-sided confidence limit on the BMD. values.
- What does the 2nd degree multistage model give as a BMDL? AIC?
BMDL: 1492 AIC: 126.98
- What does the 3rd degree multistage model give as a BMDL? AIC?
BMDL: 1492 AIC: 126.82
- Which of the BMDL values (for 2nd and 3rd degree) would you use and why?
According to the Benchmark Dose Technical Guidance, page 39: "If the BMDL estimates from the remaining models are sufficiently close (given the needs of the assessment), reflecting no particular influence of the individual models, then the model with the lowest AIC may be used to calculate the BMDL for the POD."
Exercise 2
- Open a dichotomous worksheet file. Ensure macros are enabled in the spreadsheet (refer to the BMDS Wizard User’s Reference Guide for more information).
- On the Startup tab, click the Main Page button. The Main worksheet tab is displayed.
- On the Main Page, fill in the Study and Year as “Exercise_2.” You can specify info for the Study and Modeling Inputs boxes, but it’s not necessary for this exercise. Use the Select Folder buttons to navigate to the directories.
- Click the cell in C20 to move to the Data worksheet.
- At the Data worksheet, enter the numbers from the following table into the Data worksheet. The quick way: copy the rows of numbers below and paste them into the Data worksheet starting at the Dose Group 1 row.
Dose N Response 0 86 1 0.55 81 19 1.20 81 54 - Edit the labels that will appear in the output. Edit the “Column Name in BMDS” cells so they read “Dose,” “N,” and “Response.”
- Click Return to Main to display the Main Page.
- Scroll back to the top of the Main Page. Click the AUTORUN button. You will receive an error from the BMDS Wizard that looks like the following:
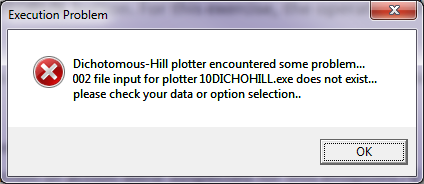
- Click OK. The Results tab will display, showing error messages for the models that could not optimize a solution.
In the following edited screenshot of the Results tab, you can see the results displayed for each model.

- Note the evaluations of each model in the BMDS Wizard Recommendation column.
- Click in each cell of the BMDS Wizard Recommendation Notes column to view the application’s logic behind its recommendations.
Questions
- Which model does the BMDS Wizard recommend and why?
The BMDS Wizard recommends the Probit model because it has the lowest BMDL and AIC. The BMDS Wizard recommends Logistic as an Alternate.
- Why do you think BMDS and BMDS Wizard evaluated so many models as “Questionable”? Why do you think the Dichotomous Hill and Multistage 3rd degree models failed?
For this analysis, we are attempting to evaluate a dataset with only three dose groups. Typically, models with n dose groups should only use up to n-1 parameters in the modeling. This is why the Wizard declares some models to be “Questionable” with the note that the model was saturated. However, models that use 3 parameters (e.g., log-logistic) on data with only 3 dose groups may adequately describe the dose-response data, but estimate the value of each parameter, thus resulting in no available degrees of freedom with which to estimate the goodness-of-fit p-value.
Careful consideration of other metrics of model fit (scaled residuals, visual fit) may indicate these models fit the data adequately and should be considered when determining the best fitting model. Models that use more than three parameters (i.e., Dichotomous Hill) cannot fit this data as the number of parameters is greater than the number of dose groups. These models may not converge properly under these circumstances; therefore, BMDS and the BMDS Wizard may display an error during the model run and/or report the model as “unusable."
Exercise 3
Model all endpoints from the following table:
| Subjects | Chamber Control | 12.8 ppm | 32 ppm | 80 ppm |
|---|---|---|---|---|
| Number examined microscopically | 50 | 50 | 49 | 49 |
| Atrophy | 3 | 12* | 35** | 48** |
| Inflammation, Chronic Active | 0 | 5* | 22** | 49** |
| Metaplasia | 6 | 5 | 26** | 48** |
| Necrosis | 0 | 7** | 26** | 39** |
** represents .01
- Create and save a separate BMDS Wizard file.
- Run all appropriate models with BMR = 10% (on the Main Page tab, you may need to add models not included as part of the default model set). A 10% BMR should be the default; to make sure, Row 59 (“BMRF") on the Main tab should be set to 0.1. Also, Row 58 (“Risk Type”) should be set to “Extra.”
A note about “adding appropriate models”: The BMDS Wizard automatically detects n-1 dose groups from the Data worksheet and displays the appropriate Multistage models. By default, the BMDS Wizard automatically includes Multistage 2 and 3 models in the included models, so for this dataset (four dose groups), no models need to be manually added. However, if the example included five dose groups, models 2 and 3 would be automatically included, but model 4 would not be. Therefore, you need to manually add model 4 to the list of models you want to run.
In this case, you would go to the Main page, select model 4 from the “Add new models to BMDS Session” list and click Add Model & Load Model Defaults. Scroll down the page to the “BMDS Model Option Setups” section and scroll to the right; you will see that a Multistage 4 column has been added to the list of models.
- Analyze and interpret the results on the Results worksheet.
- Export the results (with the chosen model Selected) to the Word Report.
Question
- Which model would you choose for each endpoint?
The recommended models for each endpoint are:
- Atrophy: Log-probit, based on lowest AIC.
- Inflammation: multistage 2nd degree, based on lowest AIC.
- Metaplasia: Log-probit, based on lowest AIC.
- Necrosis: Log-probit, based on lowest AIC.
You can follow the BMDS Wizard recommendations for the best model. For more information, you may find it helpful to refer to Section 2.5, “Decision Tree,” of the BMDS Technical Guidance; that section summarizes the general progression of steps in a BMD/BMDL calculation and considers the criteria needed for a model recommendation. On page 54, it states: “If the BMDL values from these remaining models are sufficiently close (given the needs of the assessment), the model with the lowest AIC may be selected to provide the BMDL.”
