ACE: Health - Respiratory Diseases
Indicator H1
Data characterization
- Data for this indicator are obtained from an ongoing annual survey conducted by the National Center for Health Statistics.
- Survey data are representative of the U.S. civilian noninstitutionalized population.
- A parent or other knowledgeable adult in each sampled household is asked questions regarding the child's health status, including if they have ever been told the child has asthma, if the child has had an asthma attack in the past year, and if the child currently has asthma.
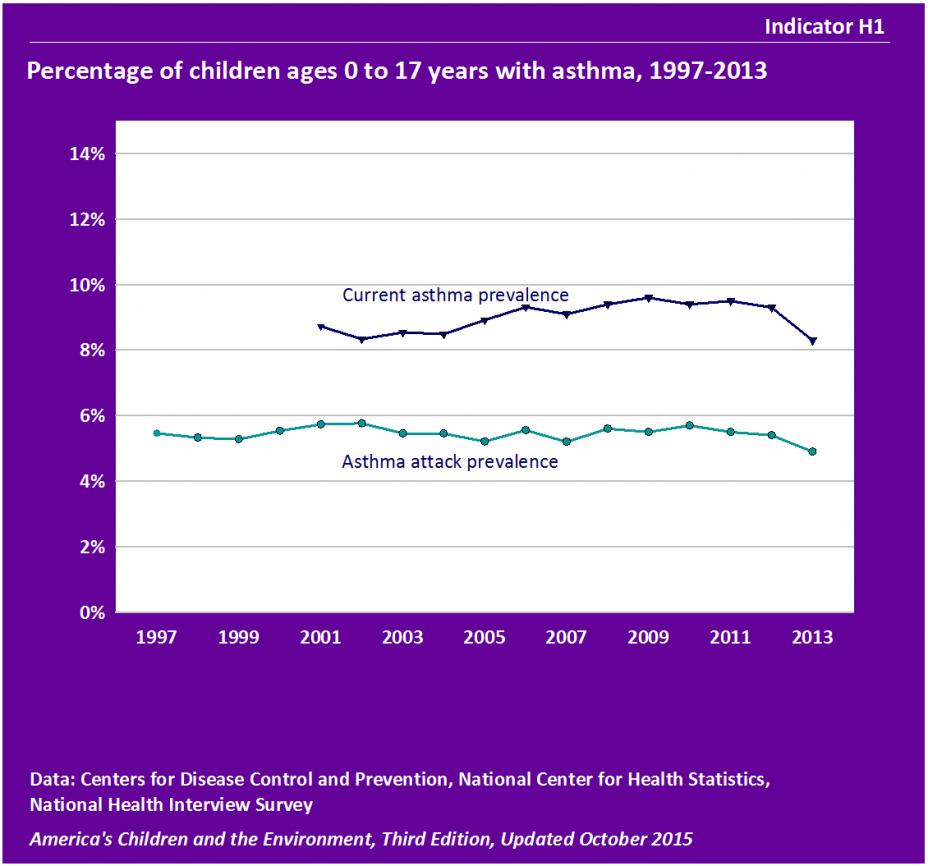
- The proportion of children reported to currently have asthma increased from 8.7% in 2001 to 9.3% in 2012, but then decreased to 8.3% in 2013. The increasing trend from 2001 to 2013 was statistically significant, as was the year-to-year decrease from 2012 to 2013.
- In 1997, 5.5% of all children were reported to have had one or more asthma attacks in the previous 12 months. There was little change in this rate between 1997 and 2012. In 2013, the rate decreased to 4.9%.
- In 2001, 61.7% of children with current asthma had one or more asthma attacks in the previous 12 months, and by 2013 this figure had declined to 57.9%. The decreasing trend from 2001 to 2013 was statistically significant. (See Table H1c.)
- Between 1980 and 1995 the percentage of children who had asthma in the past 12 months increased from 3.6% in 1980 to 7.5% in 1995. Methods for measurement of childhood asthma changed in 1997, so earlier data cannot be compared to the data from 1997–2010. (See Table H1b.)
Indicator H2
 ** Not available. The estimate is not reported because it has large uncertainty: the relative standard error, RSE, is 40% or greater (RSE = standard error divided by the estimate).
Data characterization
- Data for this indicator are obtained from an ongoing annual survey conducted by the National Center for Health Statistics.
- Survey data are representative of the U.S. civilian noninstitutionalized population.
- A parent or other knowledgeable adult in each sampled household is asked questions regarding the child's health status, including if they have ever been told the child has asthma, if the child has had an asthma attack in the past year, and if the child currently has asthma.
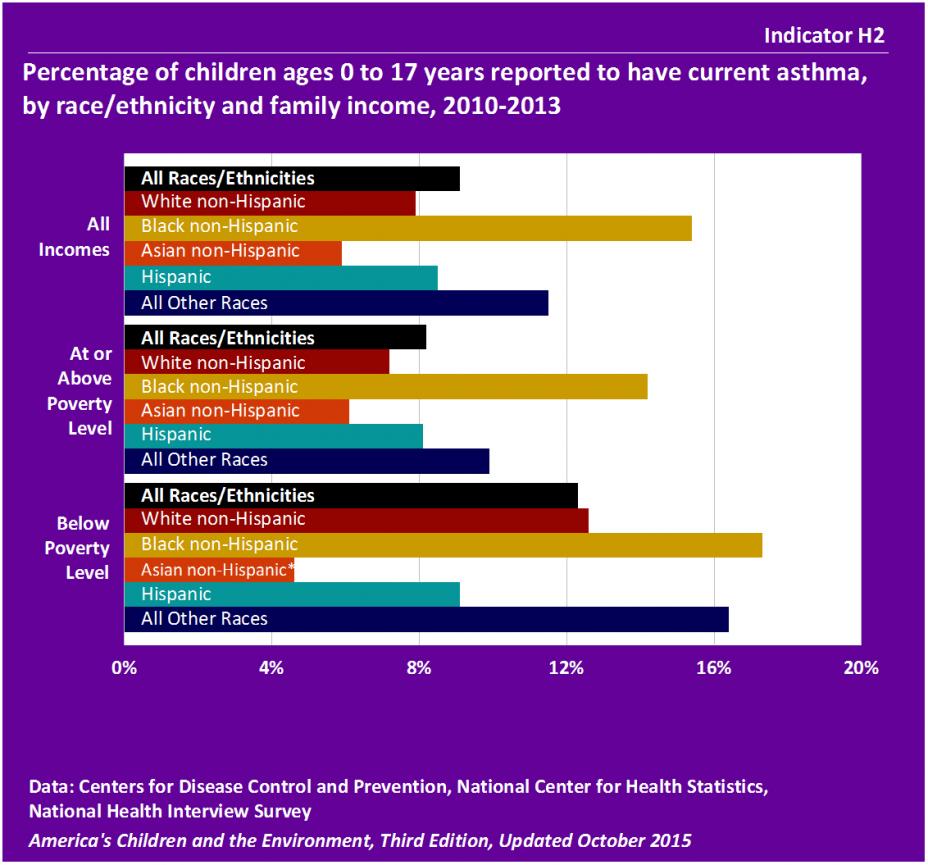
- In 2010–2013, 9.1% of all children were reported to currently have asthma.
- Among children living in families with incomes below the poverty level, 12.3% were reported to currently have asthma. Among children living in families with incomes at the poverty level and higher, 8.2% were reported to currently have asthma. This difference was statistically significant.
- n 2010–2013, the percentages of Black non-Hispanic children and children of “All Other Races” reported to currently have asthma, 15.4% and 11.5% respectively, were greater than for Hispanic children (8.5%), White non-Hispanic children (7.9%), , and Asian non-Hispanic children (5.9%).
- The differences in current asthma prevalence among Black non-Hispanic or “All Other Races” children, compared with current asthma prevalence among Hispanic, White non-Hispanic, or Asian non-Hispanic children, were statistically significant. These differences by race/ethnicity are also significant when considering only children below poverty level, except for the comparison between “All Other Races” children and White non-Hispanic children. These differences by race/ethnicity are also significant when considering only children at or above poverty level, except for the comparison between “All Other Races” children and Hispanic children.
- Among Hispanic children, about 1 in 4 Puerto Rican children (25.2%) living in families with incomes below the poverty level were reported to currently have asthma. The rate of reported current asthma for Mexican-American children living in families with incomes below the poverty level is 6.9%. This difference was statistically significant. (See Table H2.)
- Among boys, 10.0% were reported to have current asthma compared with 8.2% of girls. This difference was statistically significant. (See Table H2a.)
- Among children ages 0 to 5 years, 6.4% were reported to have current asthma compared with 10.1% of children ages 6 to 10 years and 10.8% of children ages 11 to 17 years. The difference in current asthma by age group was statistically significant. (See Table H2a.)
Indicator H3
Data characterization
- Data for this indicator are obtained from two ongoing annual surveys conducted by the National Center for Health Statistics.
- Survey data are representative of U.S. population visits to emergency rooms and stays at non-federal hospitals.
- The surveys collect data on physician diagnoses of patients in sampled hospitals, including diagnoses of asthma and other respiratory conditions.
Emergency Room Visits
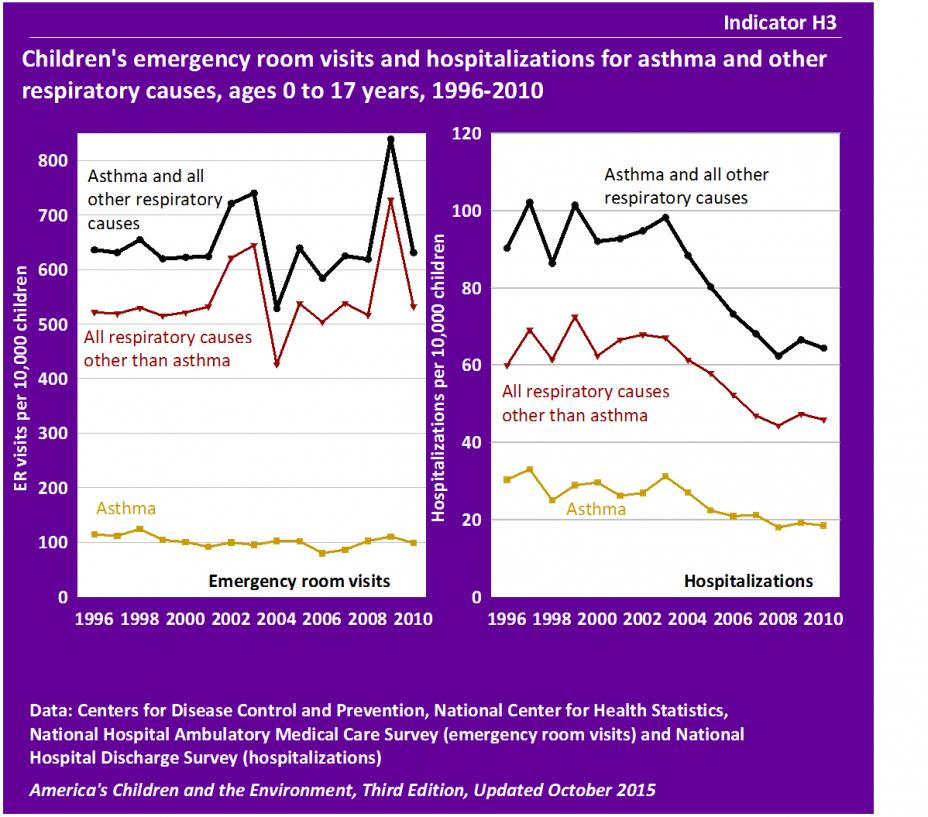
- In 2010, the rate of emergency room visits for asthma and all other respiratory causes was 631 visits per 10,000 children. The rate of emergency room visits for asthma alone was 99 visits per 10,000 children, and the rate for all respiratory causes other than asthma was 532 visits per 10,000 children.
- The rate of emergency room visits for asthma decreased from 114 visits per 10,000 children in 1996 to 99 visits per 10,000 children in 2010. This decreasing trend was statistically significant, after adjusting for sex and race/ethnicity.
- Children’s emergency room visits for asthma and all other respiratory causes vary widely by race/ethnicity. For the years 2007–2010, Black non-Hispanic children had a rate of 1,316 emergency room visits per 10,000 children, while Hispanic children had a rate of 760 emergency room visits per 10,000 children, American Indian/Alaska Native non-Hispanic children had a rate of 594 emergency room visits per 10,000 children, White non-Hispanic children had a rate of 540 emergency room visits per 10,000 children, and Asian and Pacific Islander non-Hispanic children had a rate of 387 emergency room visits per 10,000 children. (See Table H3a.)
- The difference in rates of emergency room visits between Black non-Hispanic children and emergency room visits for each of the other race/ethnicity groups was statistically significant.
- Children’s emergency room visits for asthma and all other respiratory causes vary widely by age. For the years 2007–2010, infants less than 12 months of age had a rate of 2,265 emergency room visits per 10,000 children, while children 16 to 17 years of age had a rate of 361 emergency room visits per 10,000 children. The differences between age groups were statistically significant. (See Table H3b.)
Hospitalizations
- Between 1996 and 2010, hospitalizations for asthma and all other respiratory causes decreased from 90 hospitalizations per 10,000 children to 64 hospitalizations per 10,000 children. Between 1996 and 2010, hospitalizations for asthma alone decreased from 30 per 10,000 children to 19 per 10,000 children, and hospitalizations for all other respiratory causes decreased from 60 per 10,000 children to 46 per 10,000 children. These decreasing trends were statistically significant.
- Children’s hospitalizations for asthma and all other respiratory causes vary widely by race. For the years 2007–2010, Black children had a rate of 78 hospitalizations for asthma and other respiratory causes per 10,000 children, while White children had a rate of 43 hospitalizations per 10,000 children. This difference was statistically significant. (See Table H3c.)
- Children’s hospitalizations for asthma and all other respiratory causes vary widely by age. For the years 2007–2010, infants less than 12 months of age had a rate of 370 hospitalizations per 10,000 children, while children 16 to 17 years of age had a rate of 16 hospitalizations per 10,000 children. The differences between age groups were statistically significant. (See Table H3d.)
About the Respiratory Diseases Indicators
Indicators H1 and H2 present information about children with asthma, and Indicator H3 presents information on emergency room visits and hospitalizations due to asthma and other respiratory causes. The data for Indicators H1 and H2 are from a national survey that collects health information from a representative sample of the population every year. The data for Indicator H3 are from two national surveys that collect data on emergency room visits and hospitalizations.
- Indicator H1 presents the percentage of children ages 0 to 17 years with asthma from 1997-2013.
- Indicator H2 presents the percentage of children ages 0 to 17 years with current asthma, by race/ethnicity and family income, in 2007-2013.
- Indicator H3 presents emergency room visits and hospitalizations for asthma and other respiratory causes in children ages 0 to 17 years from 1996-2010.
Respiratory diseases and illness, such as asthma, bronchitis, pneumonia, allergic rhinitis, and sinusitis, can greatly impair a child's ability to function and are an important cause of missed school days and limitations of activities. Symptoms associated with both mild and more severe manifestations of these respiratory conditions include cough, wheeze, congestion, chest pain, shortness of breath, respiratory distress, and possibly death in the most extreme cases. Asthma is a particularly complex respiratory disease with many factors, genetic and environmental, which interact to influence its development and severity.
Four common air pollutants (particulate matter, ground-level ozone, nitrogen oxides, and sulfur oxides) have extensive evidence linking them to respiratory diseases in children. Pollution from traffic-related sources, a mix of air pollutants, appears to pose particular threats to a child's respiratory system. Children can also be exposed to air pollution inside homes, schools, and other buildings. Indoor air pollutants from biological sources (such as mold, dust mites, or pet dander) can lead to allergic reactions, exacerbate existing asthma, and have been associated with the development of respiratory symptoms.
Indicators H1 and H2 present data on asthma prevalence for children from the National Health Interview Survey (NHIS). Indicator H3 presents data on children's emergency room visits and hospitalizations from the National Hospital Ambulatory Medical Care Survey (NHAMCS) and the National Hospital Discharge Survey (NHDS).
More information about respiratory diseases and Indicators H1, H2, and H3 is provided in the updated Respiratory Diseases section of America's Children and the Environment, Third Edition.
Related Links
Centers for Disease Control and Prevention (CDC): Air Pollution & Respiratory Health
Centers for Disease Control and Prevention (CDC): Asthma
Data Resource Center for Child and Adolescent Health: Survey Results Exit
Health Effects Institute (HEI): Traffic-Related Air Pollution: A Critical Review of the Literature on Emissions, Exposure, and Health Effects Exit
U.S. EPA: Air Quality: EPA's Integrated Science Assessments (ISAs)
Summary of Methods - Respiratory Diseases
The National Center for Health Statistics, a division of the Centers for Disease Control and Prevention, conducts the National Health Interview Survey (NHIS), a series of annual U.S. national surveys of the health status of the noninstitutionalized civilian population. The interviews are conducted in person at the participants’ homes by asking a parent or other knowledgeable household adult questions regarding the child’s health status.
Indicator H1 uses the NHIS data to present the percentages of children ever diagnosed with asthma that also had an asthma attack in the previous 12 months, and of children that currently have asthma. Indicator H2 uses the NHIS data to present the percentages of children that currently have asthma, stratified by race/ethnicity and family income. For these indicators we used the responses to the following questions: “Has a doctor or other health professional ever told you that <child’s name> had asthma?” and if yes, “During the past 12 months, has <child’s name> had an episode of asthma or an asthma attack?”, “Does <child’s name> still have asthma?”, and “Did <child’s name> have this condition in the past 12 months?”
The National Hospital Ambulatory Medical Care Survey (NHAMCS) and the National Hospital Discharge Survey (NHDS) are both conducted by the National Center for Health Statistics. These surveys provide national data on emergency room visits and hospitalizations. The NHAMCS collects data for physician diagnoses for visits to hospital emergency rooms and outpatient departments, and the NHDS reports physician diagnoses for discharges from hospitals. The diagnoses in both surveys include asthma and a number of other respiratory conditions. Both surveys exclude federal and military hospitals and report patient demographic information.
Indicator H3 uses the NHAMCS and NHDS data to present emergency room visits and hospitalizations for asthma and other respiratory conditions including bronchitis, pneumonia, and influenza for children ages 0 to 17 years.
Detailed Methods for Indicators H1, H2, and H3
Metadata for National Health Interview Survey (NHIS)
Metadata for National Hospital Ambulatory Medical Care Survey (NHAMCS)
Metadata for National Hospital Discharge Survey (NHDS)