ACE: Health - Neurodevelopmental Disorders
Indicator H6 
Data characterization
- Data for this indicator are obtained from an ongoing annual survey conducted by the National Center for Health Statistics.
- Survey data are representative of the U.S. civilian noninstitutionalized population.
- A parent or other knowledgeable adult in each sampled household is asked questions regarding the child's health status, including if they have ever been told the child has Attention Deficit/Hyperactivity Disorder (ADHD).
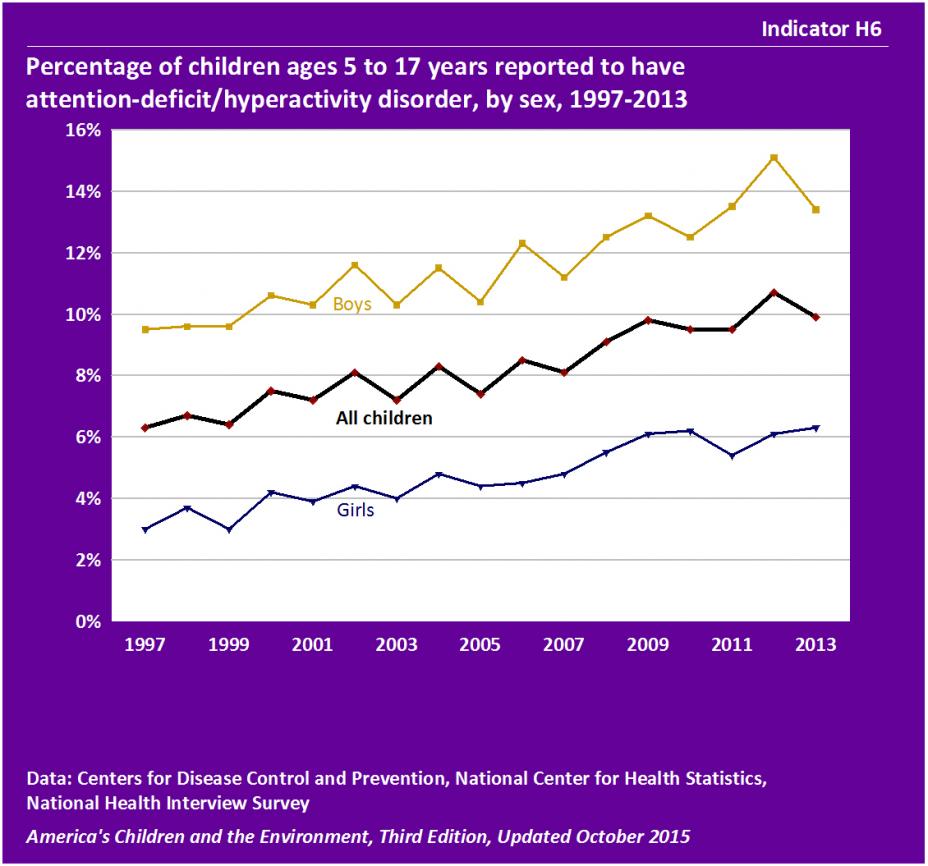
- From 1997 to 2013, the proportion of children ages 5 to 17 years reported to have ever been diagnosed with attention-deficit/hyperactivity disorder (ADHD) increased from 6.3% in 1993 to 10.7% in 2012 and 9.9% in 2013.
- The increasing trend was statistically significant for children overall, and for both boys and girls considered separately.
- For the years 2010–2013, the percentage of boys reported to have ADHD (13.7%) was higher than the rate for girls (6.0%). This difference was statistically significant. (See Table H6a.)
- In 2010–2013, 11.9% of White non-Hispanic children, 11.8% of children of “All Other Races,” 10.1% of Black non-Hispanic children, 6.2% of Hispanic children, and 2.1% of Asian non-Hispanic children were reported to have ADHD. (See Table H6b.)
- These differences were statistically significant, with two exceptions: there was no statistically significant difference between children of “All Other Races” and White non-Hispanic children, or between children of “All Other Races” and Black non-Hispanic children.
- In 2010–2013, 13.1% of children from families living below the poverty level were reported to have ADHD compared with 9.1% of children from families living at or above the poverty level. This difference was statistically significant. (See Table H6b.)
Indicator H7
Data characterization
- Data for this indicator are obtained from an ongoing annual survey conducted by the National Center for Health Statistics.
- Survey data are representative of the U.S. civilian noninstitutionalized population.
- A parent or other knowledgeable adult in each sampled household is asked questions regarding the child's health status, including if they have ever been told the child has a learning disability.
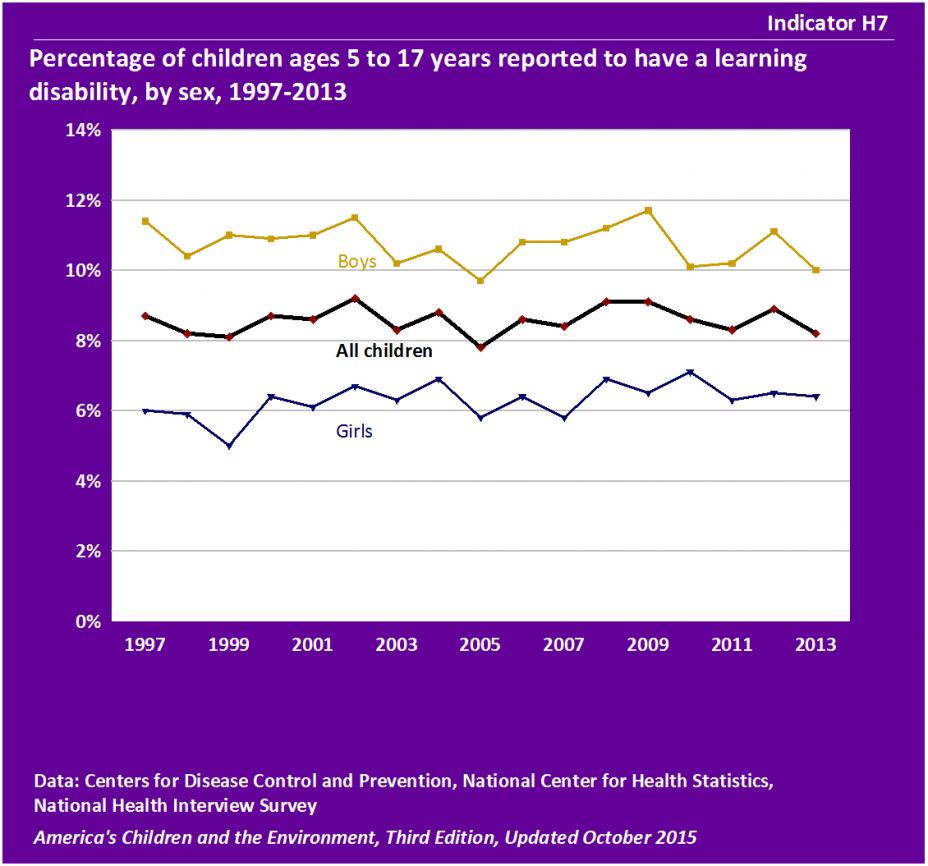
- In 2013, 8.2% of children ages 5 to 17 years had ever been diagnosed with a learning disability. There was little change in this percentage between 1997 and 2013.
- For the years 2010–2013, the percentage of boys reported to have a learning disability (10.4%) was higher than for girls (6.6%). This difference was statistically significant. (See Table H7a.)
- The reported prevalence of learning disability varies by race and ethnicity. The highest percentages of learning disability are reported for American Indian or Alaska Native non-Hispanic children (12.7%), Black non-Hispanic children (9.8%), children of “All Other Races” (9.6%), and White non-Hispanic children (8.9%). By comparison, 7.6% of Hispanic children are reported to have a learning disability, and Asian non-Hispanic children have the lowest prevalence of learning disability, at 3.0%. (See Table H7b.)
- The prevalence of learning disability reported for Hispanic children and for Asian non-Hispanic children were lower than for the remaining race/ethnicity groups, and these differences were statistically significant. The difference in prevalence between Hispanic and Asian non-Hispanic children was also statistically significant.
- For the years 2010–2013, the percentage of children reported to have a learning disability was higher for children living below the poverty level (12.8%) compared with those living at or above the poverty level (7.4%), a statistically significant difference. (See Table H7b.)
Indicator H8
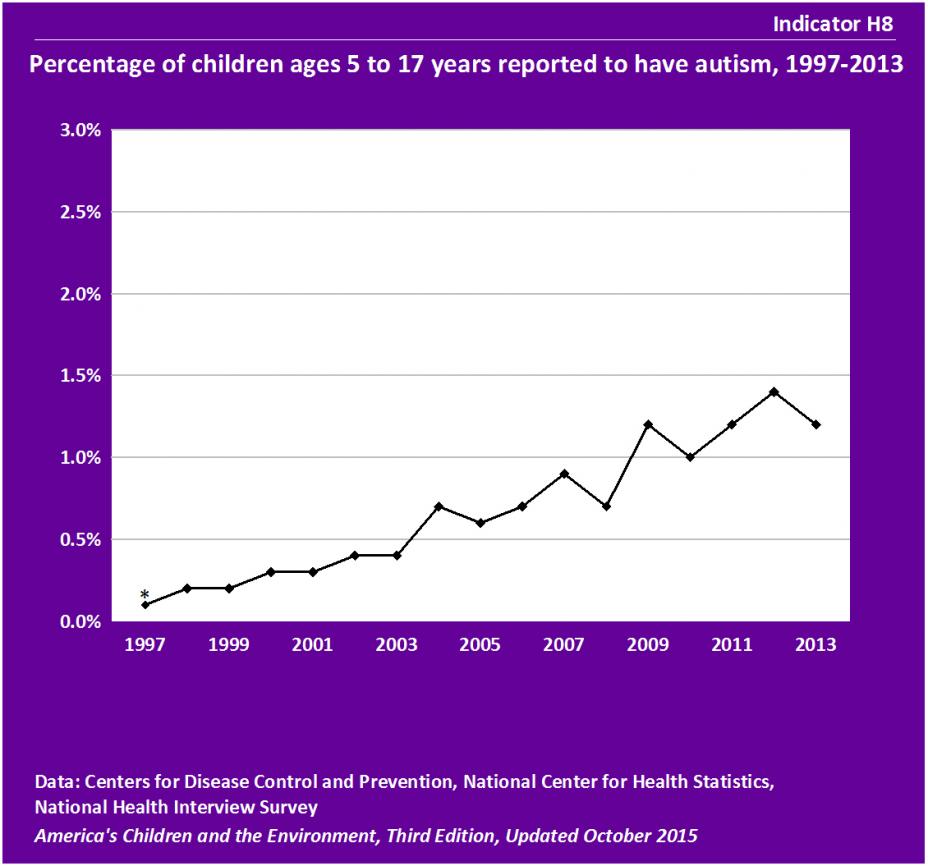 * The estimate should be interpreted with caution because the standard error of the estimate is relatively large: the relative standard error, RSE, is at least 30% but is less than 40% (RSE = standard error divided by the estimate).
Data characterization
- Data for this indicator are obtained from an ongoing annual survey conducted by the National Center for Health Statistics.
- Survey data are representative of the U.S. civilian noninstitutionalized population.
- A parent or other knowledgeable adult in each sampled household is asked questions regarding the child's health status, including if they have ever been told the child has autism.
- The percentage of children ages 5 to 17 years reported to have ever been diagnosed with autism rose from 0.1% in 1997 to 1.2% in 2013. This increasing trend was statistically significant.
- For the years 2010–2013, the rate of reported autism was more than four times higher in boys than in girls, 1.9% and 0.4%, respectively. This difference was statistically significant. (See Table H8a.)
- The reported prevalence of autism varies by race/ethnicity. The highest prevalence of autism is for children of “All Other Races” (1.7%) and White non-Hispanic children (1.4%). Autism prevalence was lower among Asian non-Hispanic children (1.1%), Black non-Hispanic children (0.8%), and Hispanic children (0.9%). (See Table H8b.)
- The prevalence of autism for both White non-Hispanic children and children of “All Other Races” was statistically significantly different from the prevalence for both Black non-Hispanic children and Hispanic children.
- For the years 2010–2013, the prevalence of autism was similar for children living below the poverty level and those living at or above the poverty level. (See Table H8b.)
Indicator H9
Data characterization
- Data for this indicator are obtained from an ongoing annual survey conducted by the National Center for Health Statistics.
- Survey data are representative of the U.S. civilian noninstitutionalized population.
- A parent or other knowledgeable adult in each sampled household is asked questions regarding the child's health status, including if they have ever been told the child has mental retardation.
- A parent or other knowledgeable adult in each sampled household is asked questions regarding the child’s health status, including if they have ever been told the child has mental retardation. Starting in 2011, the term “mental retardation” in the question was revised to “an intellectual disability, otherwise known as mental retardation.”
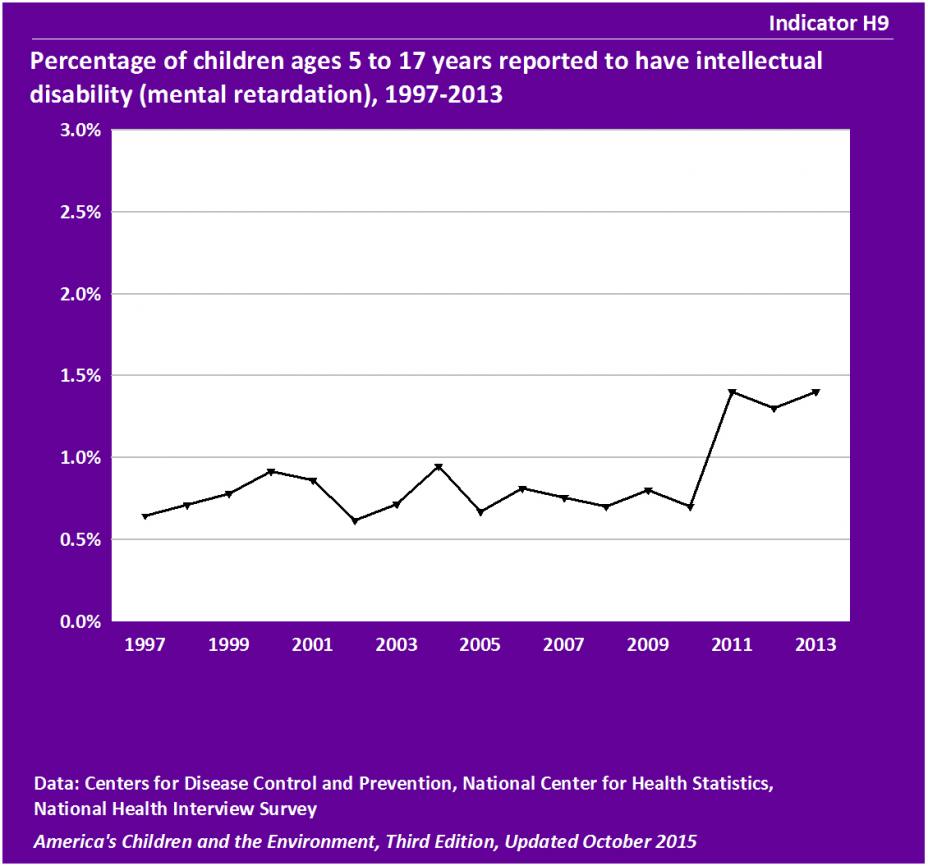
- In 2013, 1.4% of children ages 5 to 17 years were reported to have ever been diagnosed with intellectual disability (mental retardation). This percentage fluctuated between 0.6% and 0.9% from 1997 to 2010, and was between 1.3% and 1.4% from 2011 to 2013.
- In 2010–2013, the percentage of boys reported to have intellectual disability (1.6%) was higher than for girls (0.8%). This difference was statistically significant. (See Table H9a.)
- In 2010–2013, there was little difference by race/ethnicity in the reported prevalence of intellectual disability. (See Table H9b.)
- In 2010–2013, 17% of children from families with incomes below the poverty level were reported to have intellectual disability, compared with 1.1% of children from families at or above the poverty level, a statistically significant difference. (See Table H9b.)
About the Neurodevelopmental Disorders Indicators
Indicators H6, H7, H8, and H9 present information about children reported to have ever been diagnosed with four different neurodevelopmental disorders: attention-deficit/hyperactivity disorder (ADHD), learning disabilities, autism, and intellectual disability. The data are from a national survey that collects health information from a representative sample of the population each year.
- Indicator H6 presents the percentage of children ages 5 to 17 years reported to have attention-deficit/hyperactivity disorder, by sex, from 1997-2013.
- Indicator H7 presents the percentage of children ages 5 to 17 years reported to have a learning disability, by sex, from 1997-2013.
- Indicator H8 presents the percentage of children ages 5 to 17 years reported to have autism from 1997-2013.
- Indicator H9 presents the percentage of children ages 5 to 17 years reported to have intellectual disability (mental retardation) from 1997-2013.
Neurodevelopmental disorders are disabilities associated primarily with the functioning of the neurological system and brain. Examples of neurodevelopmental disorders in children include attention-deficit/hyperactivity disorder (ADHD), autism, learning disabilities, intellectual disability (also known as mental retardation), conduct disorders, cerebral palsy, and impairments in vision and hearing. Children with neurodevelopmental disorders can experience difficulties with language and speech, motor skills, behavior, memory, learning, or other neurological functions.
Several widespread environmental contaminants are associated with adverse effects on a child's developing brain and nervous system in multiple studies. The National Toxicology Program (NTP) has concluded that childhood lead exposure is associated with attention-related behavioral problems (such as inattention, hyperactivity, or attention-deficit/hyperactivity disorder) and increased incidence of problem behaviors (including delinquent, criminal, or antisocial behavior). EPA has determined that methylmercury is known to have neurotoxic and developmental effects in humans. A wide variety of other environmental chemicals have been identified as potential concerns for childhood neurological development based on animal studies and observational studies in humans.
Indicators H6, H7, H8, and H9 present data on neurodevelopmental disorders from the National Health Interview Survey (NHIS).
More information about neurodevelopmental disorders and Indicators H6, H7, H8, and H9 is provided in the updated Neurodevelopmental Disorders section of America's Children and the Environment, Third Edition.
Related Links
National Institute of Mental Health (NIMH): Attention Deficit Hyperactivity Disorder (ADHD)
National Toxicology Program (NTP): Health Effects of Low-Level Lead Evaluation
Summary of Methods - Neurodevelopmental Disorders
The National Center for Health Statistics, a division of the Centers for Disease Control and Prevention, conducts the National Health Interview Survey (NHIS), a series of annual U.S. national surveys of the health status of the noninstitutionalized civilian population. The interviews are conducted in person at the participants’ homes by asking a parent or other knowledgeable household adult questions regarding the child’s health status.
Indicators H6 and H7 use the NHIS data to present the percentage of children ages 5 to 17 years who were reported to have ADHD or learning disability, respectively, stratified by sex. Indicators H8 and H9 use the NHIS data to present the percentage of children ages 5 to 17 years who were reported to have autism or intellectual disability (mental retardation), respectively. For these indicators we used the responses to the following questions: “Has a doctor or health professional ever told you that <child’s name> had Attention Deficit/Hyperactivity Disorder (ADHD) or Attention Deficit Disorder (ADD)?”, “Has a representative from a school or a health professional ever told you that <child’s name> had a learning disability?”, “Has a doctor or health professional ever told you that <child’s name> had Autism?”, “Has a doctor or health professional ever told you that <child’s name> had Mental Retardation?” Starting in 2011, the survey question for mental retardation changed to “Has a doctor or health professional ever told you that had an intellectual disability, also known as mental retardation?”