Global Mitigation of Non-CO2 Greenhouse Gases: Croplands
Key Points
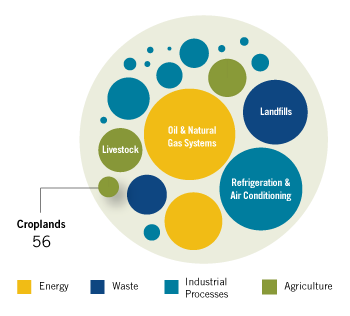
- The global abatement potential of the croplands sector is 56 million metric tons of carbon dioxide equivalent (MtCO2e) in 2030, 12% of baseline emissions.
- Seven abatement options were analyzed to reduce soil management emissions.
- Over 80% of reductions result from the implementation of no-till cultivation and reduced fertilizer applications.
Sector Description
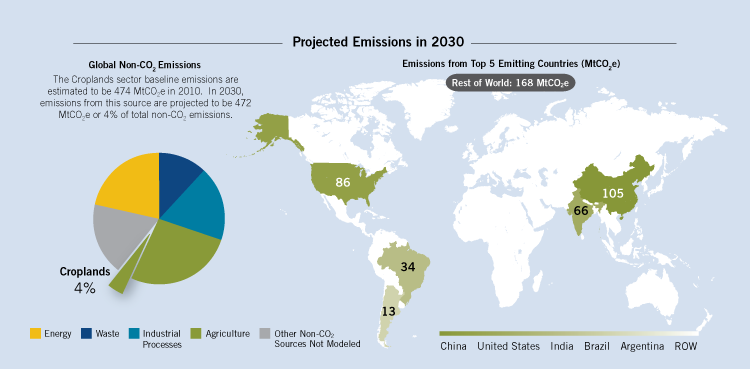
Land management in croplands influences soil nitrous oxide (N2O) emissions (influenced by fertilization practices, soil drainage, and nitrogen mineralization), methane (CH4) fluxes, and soil organic carbon (C) stocks (and associated carbon dioxide [CO2] fluxes to the atmosphere). The report considers only major crops (barley, maize, sorghum, soybeans, and wheat) and minor crops closely related to these (rye, lentils, other beans, and oats). Global baseline emissions from the croplands sector in 2010 were estimated at 474 MtCO2e. Projected emissions are relatively constant, decreasing to approximately 460 MtCO2e in 2020 and rebounding to 472 MtCO2e by 2030.
 View or download the full-size image here.(129 K, PNG)
Emissions Reduction Potential
Assuming full implementation of current technology, emissions in the cropland sector could be reduced by up to 56 MtCO2e in 2030. This accounts for 1% of the 4,615 MtCO2e in global reduction potential in 2030.
 View or download the full-size image here.(99 K, PNG)
Abatement Potential
Technologically feasible global abatement potential in the croplands sector is estimated to be 70 MtCO2e in 2020 and 56 MtCO2e in 2030, representing 15% and 12% reductions compared to the baseline. In 2030, abatement measures that break even (i.e., ≤ $0/tCO2e) can reduce nearly 30 MtCO2e. Additional reductions are achievable with the inclusion of more costly abatement measures. For example, the level of reduced emissions increases to 37 MtCO2e by including abatement measures with implementation costs less than or equal to $30/tCO2e.
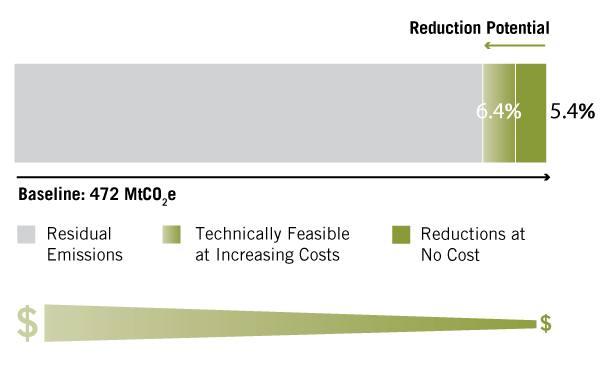 It would be cost-effective to reduce emissions by 5.4%, compared to the baseline, in 2030. An additional 6.4% reduction is available using technologies with increasingly higher costs.
View or download the full-size image here.(38 K, PNG)
Abatement Measures
Six abatement measures were considered for the croplands sector: adoption of no-till cultivation, reduced fertilizer application, increased fertilizer application, split nitrogen fertilization, application of nitrification inhibitors, and crop residue incorporation. Before 2020, the majority of reductions result from the implementation of no-till cultivation (70% in 2010, 60% in 2020). In 2030, the majority of reductions (96%) are shared between no-till, reduced fertilization, and nitrification inhibitors.
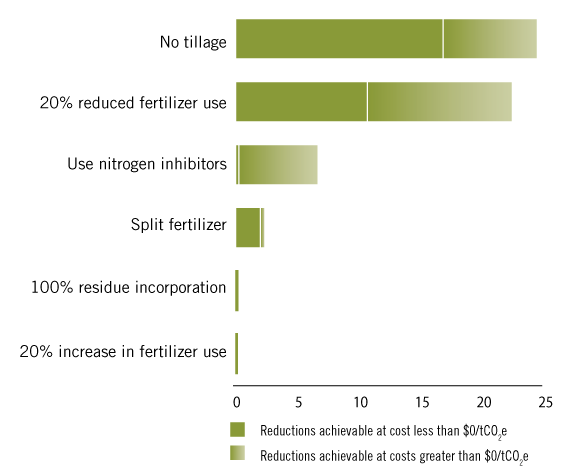 Emissions reductions by technology in 2030 at $0/tCO2e and at higher prices.
View or download the full-size image here.(37 K, PNG)