Data Tables and Map Services
Indicator Data. One route to obtaining watershed indicator data from WSIO is through creating and downloading a custom WSIO Tool with user-selected data for their area of interest. WSIO indicator data tables containing all active WSIO indicators are also available for download below. The lower 48 states' currently available data are split into ten data tables that correspond with EPA Regions 1 through 10. Each regional data table is an Excel .xlsx file containing approximately 460 watershed indicators compiled at the HUC12 scale. Metadata are included in each file.
WSIO Indicator Data for EPA Region 1 (includes CT, ME, MA, NH, RI, VT) (4 pp, 8 MB)
WSIO Indicator Data for EPA Region 2 (includes NJ, NY) (4 pp, 8 MB)
WSIO Indicator Data for EPA Region 3 (includes PA, WV, VA, MD, DE, DC) (4 pp, 15 MB)
WSIO Indicator Data for EPA Region 4 (includes KY, TN, NC, SC, MS, AL, GA, FL) (4 pp, 42 MB)
WSIO Indicator Data for EPA Region 5 (includes IL, IN, MN, MI, OH, WI) (4 pp, 42 MB)
WSIO Indicator Data for EPA Region 6 (includes TX, NM, AR, OK, LA) (4 pp, 51 MB)
WSIO Indicator Data for EPA Region 7 (includes KS, NE, IA, MO) (4 pp, 29 MB)
WSIO Indicator Data for EPA Region 8 (includes CO, WY, UT, ND, SD, MT) (4 pp, 58 MB)
WSIO Indicator Data for EPA Region 9 (includes CA, AZ, NV) (4 pp, 34 MB)
WSIO Indicator Data for EPA Region 10 (includes WA, OR, ID) (4 pp, 27 MB)
Indicator Metadata. This Excel .xlsx file contains indicator names, definitions and data source information for all WSIO indicators. It is the same metadata file that appears in each of the downloadable WSIO data tables. Some of the most commonly used datasets are available as map services from this site, as described below. A map service makes maps, features, and attribute data available online and can be used in a variety of applications.
WSIO Metadata and List of Indicators (2 pp, 178 K)
Map Services. Some frequently used WSIO geospatial datasets are available as map services through this site. These are GIS datasets, not tabular indicator data.
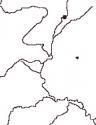
 Conterminous US Watershed Hydrologic Unit Code (HUC12) Boundary Layer. This is the exact version of the HUC12 boundaries used in WSIO indicator compilation, offered here because HUC12 boundaries available through other sites sometimes undergo minor revisions without notice. This dataset is consistent with the "WBD Snapshot" version of HUC12 boundaries that was integrated with the National Hydrography Dataset (NHD) Plus version 2 nationally, and is a common source used by most EPA water projects involving geospatial watershed data.
HUC12 Watershed Boundaries Map Service
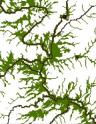
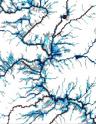
 Water Mask. This dataset was developed using grid analysis to combine surface water features (rivers, lakes, reservoirs, estuaries, wetlands, oceans) of the National Land Cover Dataset (NLCD) and the 1:100,000 scale National Hydrography Dataset (NHD) Plus version 2 (which includes mapped point, linear and areal surface water features). The combination of these two datasets represents surface waters of all kinds and is referred to as the Water Mask.
Water Mask Dataset Map Service
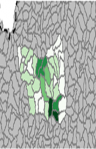
 Hydrologically Connected Zone. The Hydrologically Connected Zone (HCZ) is determined using grid analysis to combine surface water features of the National Land Cover Dataset (NLCD) and the 1:100,000 scale National Hydrography Dataset (NHD) Plus version 2 with areas contiguous to surface water that also have a wetness index value of 550 or greater. The combination of these three datasets represent the Hydrologically Connected Zone (HCZ).
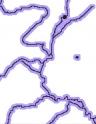 Riparian Zone. The Riparian Zone (RZ) is determined using grid analysis of an approximate 100 meter buffer placed around the combined surface water features of the National Land Cover Dataset (NLCD) and the 1:100,000 scale National Hydrography Dataset (NHD) Plus version 2. The combination of these two datasets and all cells with a distance of 108 meters or less from surface water are included in the Riparian Zone (RZ).
 Wetness Index. The Wetness Index is a Computed Topographic Index (CTI) derived from the National Hydrography Dataset Plus flow accumulation and slope of the Digital Elevation Model using the equation: grid wet_ndx = 100*(ln (flow accumulation/tan(slope)) + 3x3 mean of ln (flow accumulation/tan(slope))/2. This information was used to identify areas in the landscape likely to be wet. Values greater than 800 have been determined to represent areas which are usually wet.