2013 TRI National Analysis: TRI & Beyond - Comparing TRI and Greenhouse Gas Emissions
Section 1: Comparing TRI and Greenhouse Gas Emissions
What is CO2e?
GHG emissions are typically expressed in a common metric so that their impacts can be directly compared as some gases are more potent than others. The international standard practice is to express GHGs in CO2e.
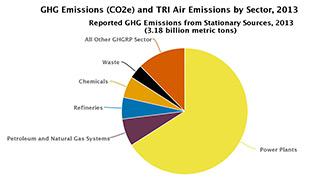
What chemicals were reported to GHGRP for 2013?
- Carbon dioxide = 91.4% of the mtCO2e total
- Methane = 7%
- Nitrous Oxide (N2O) = 0.8%
- Fluorinated Gases (HFCs, PFCs, SF6) = 0.7%
Under the authority of the Clean Air Act, EPA's Greenhouse Gas Reporting Program (GHGRP) requires large emitters of greenhouse gases and suppliers of certain products to submit annual greenhouse gas reports to EPA. Emissions of greenhouse gases lead to elevated concentrations of these gases in the atmosphere that alter the Earth's radiative balance and contribute to climate change. These elevated concentrations are reasonably anticipated to endanger both the public health and welfare of current and future generations. The purpose of GHGRP is to collect timely, industry-specific data to help us better understand the source of greenhouse gas emissions and to inform climate policy.
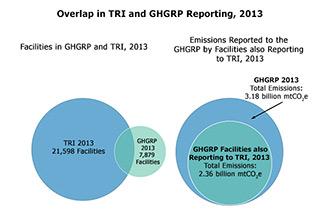
In 2013, over 7,800 facilities reported direct emissions of GHGs to the atmosphere, totaling over 3.18 billion metric tons of carbon dioxide equivalent (mtCO2e). This represents about half of the 6.6 billion mtCO2e that EPA estimated released in the United States from all human-related sources per the 2012 annual U.S. Greenhouse Gas Inventory. The GHGRP does not require direct emissions reporting from all U.S. sources. For example, the transportation sector and agricultural sources of GHG emissions are not included in the GHGRP.
This page was published in January 2015 and uses the 2013 TRI National Analysis dataset made public in TRI Explorer in October 2014.