2013 TRI National Analysis: Comparing Industry Sectors

Comparing Industry Sectors
Individual industry sectors reporting to TRI can vary substantially in size, scope, and makeup, therefore, the amounts and types of toxic chemicals generated and managed by each differ greatly. Within a sector, however, the industrial processes, products, and regulatory requirements are often similar, resulting in similar toxic chemical use and waste generation. Therefore, it is useful to look at waste management trends within a sector to identify potential emerging issues and opportunities for better waste management practices.
This chapter examines which sectors contribute the most to production-related waste managed and total disposal or other releases in 2013, and highlights several industry sectors to show trends occurring over time within each. For analysis purposes, the TRI program has combined 3- and 4-digit NAICS codes to create 26 distinct industry sector categories.
This pie chart shows that 86% of production-related waste was reported from seven industry sectors. More than 60% originated from three sectors: chemicals (42%), primary metals (11%), and metal mining (7%).
This pie chart shows that 92% of total disposal or other releases of TRI chemicals originated from seven of the 26 TRI industry sectors. More than two-thirds originated from just three industry sectors: metal mining (47%), electric utilities (13%), and chemicals (12%). Both metal mining and chemical sectors are in the top three for waste management and total releases.
Over time, the amounts and proportions of TRI chemicals managed including how released have varied. For more details, see the production-related waste managed by industry trend graph and the releases by industry trend graph.
Some sectors have reported a significant percentage decrease in production-related waste managed and releases in recent years. For more information on these sectors and their reported source reduction activities, see the industry sectors with largest percentage decrease in releases graph and the types of source reduction activities graph.
It is also important to consider the influence that production and the economy have on waste managed and releases. For more information, see the production-related waste managed and value added by the manufacturing sector graph and the total releases and value added by the manufacturing sector graph.
| Sections in this chapter | |
|---|---|
Chemical Manufacturing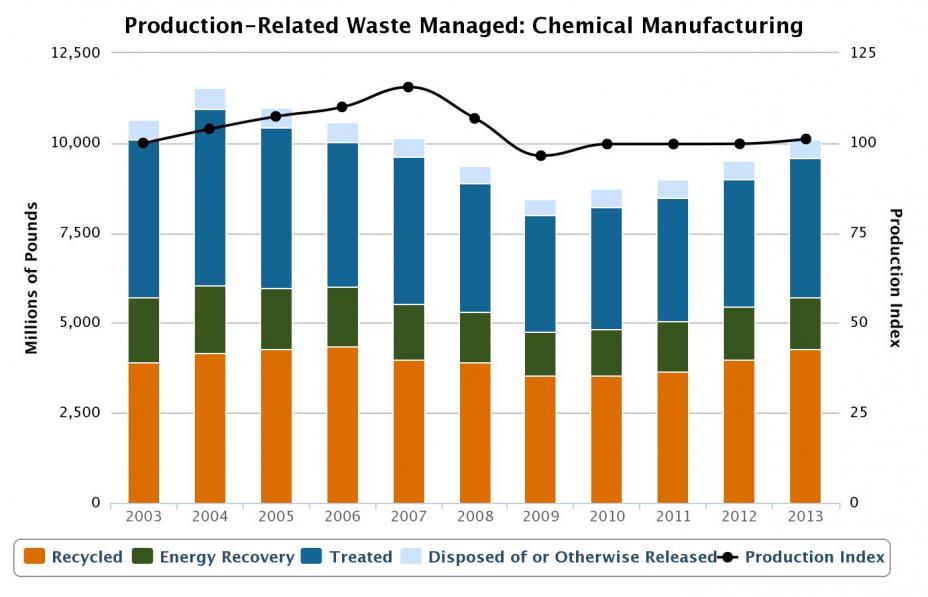 |
Metal Mining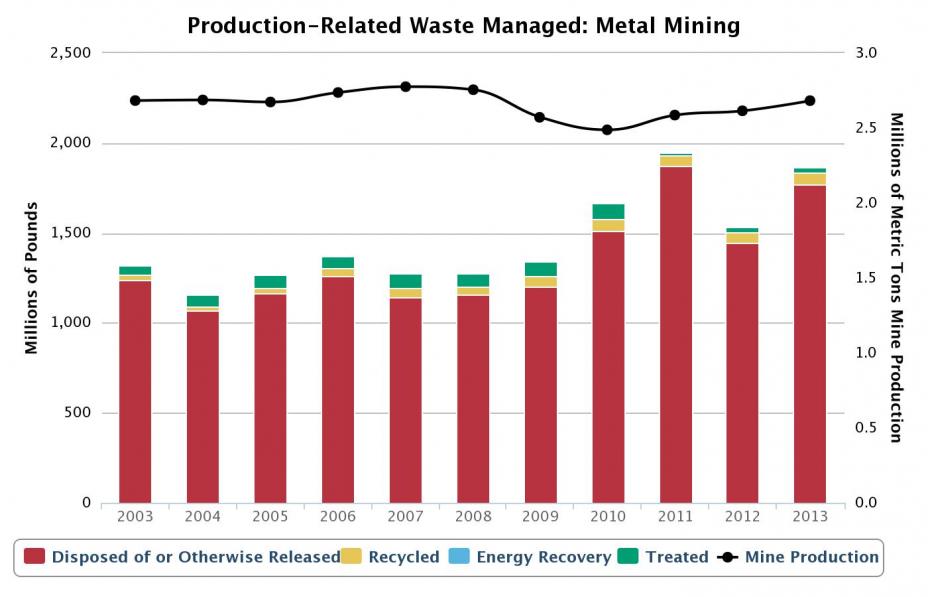 |
Electric Utilities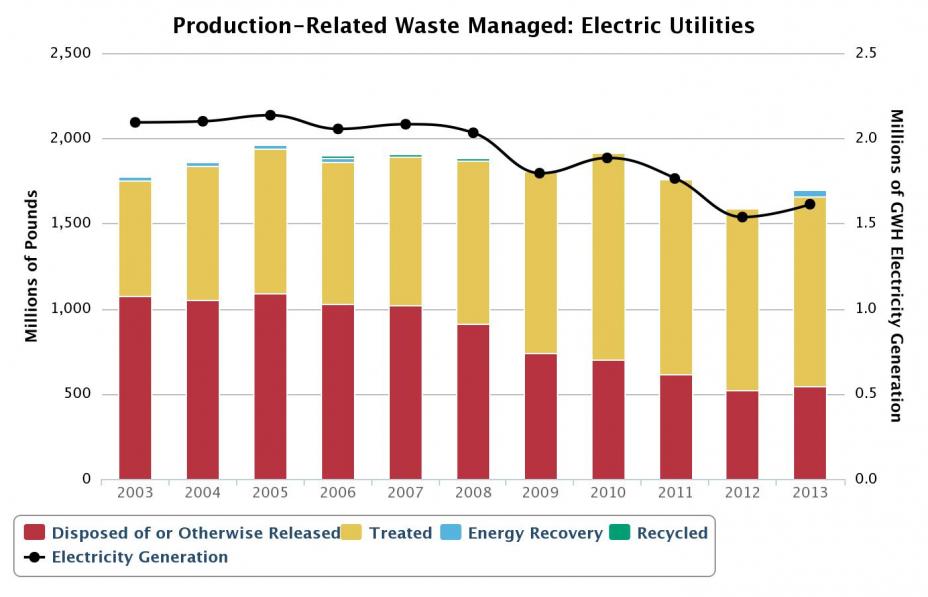 |
Petroleum Refining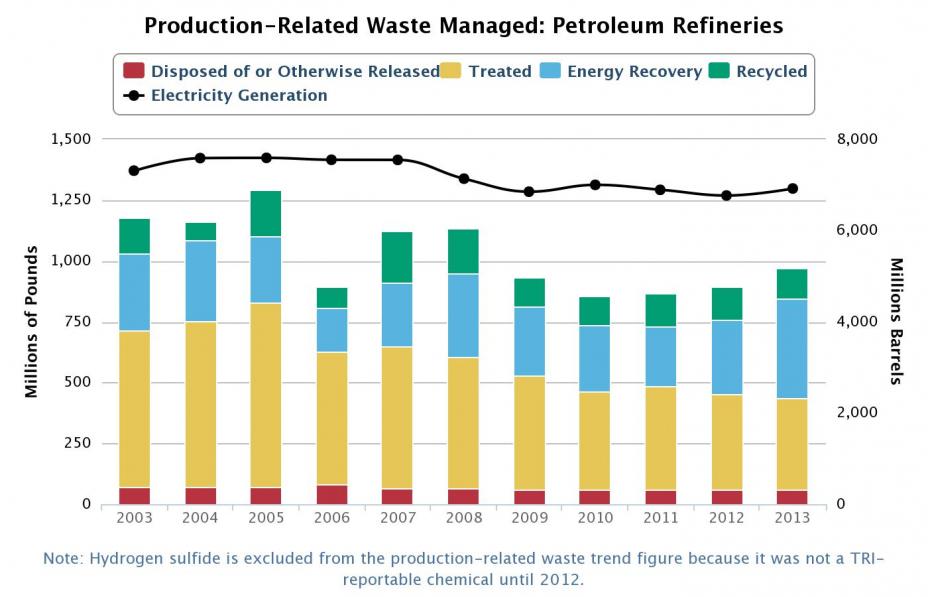 |
This page was published in January 2015 and uses the 2013 TRI National Analysis dataset made public in TRI Explorer in October 2014.