Advancing Sustainable Materials Management: Facts and Figures
On this page:
- Materials and Waste Management in the United States Key Facts and Figures
- U.S. State and Local Waste and Materials Characterization Reports
Materials and Waste Management in the United States Key Facts and Figures
Each year, EPA produces a report called Advancing Sustainable Materials Management: Facts Sheet, formerly called Municipal Solid Waste in the United States: Facts and Figures. It includes information on municipal solid waste (MSW) generation, recycling, combustion with energy recovery and landfilling. The 2014 fact sheet also includes information on Construction and Demolition Debris generation, which is outside of the scope of MSW.
In 2014, in the United States, about 258 million tons of MSW were generated. Over 89 million tons of MSW were recycled and composted, equivalent to a 34.6 percent recycling rate. In addition, over 33 million tons of MSW were combusted with energy recovery and 136 million tons were landfilled.
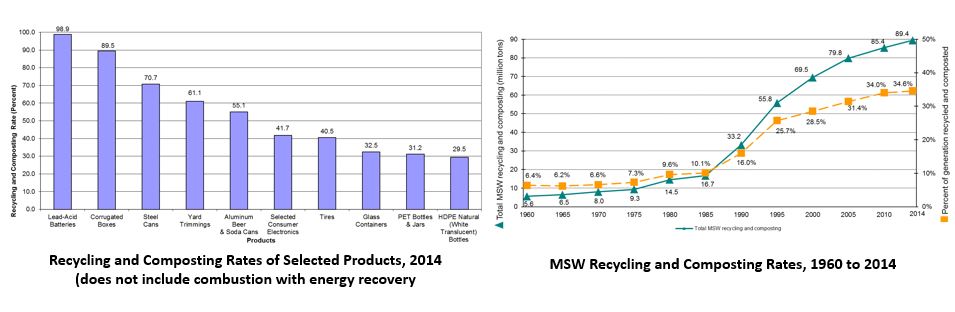 Graphs depicting the recycling rates of selected products in 2014 and the MSW recycling rates from 1960 to 2014. Click image to view larger version.
In 2014, 89.5 percent of corrugated boxes were recycled. About 61 percent of yard trimmings were composted. Organic materials such as paper and paperboard, yard trimmings and food were the largest component of MSW generated. Paper and paperboard accounted for over 26 percent, and yard trimmings and food accounted for another 28.2 percent. Plastics comprised about 13 percent of MSW; rubber, leather and textiles accounted for over nine percent; and metals made up nine percent. Wood followed at over six percent, and glass over four percent. Other miscellaneous wastes made up approximately three percent of the MSW generated in 2014.
Recycling and composting of MSW results in greenhouse gas (GHG) emissions reduction. In 2014, the 89 million tons of MSW recycled and composted provided an annual reduction of over 181 million metric tons of carbon dioxide equivalent emissions, comparable to the annual emissions from over 38 million passenger cars.
To aid researchers, EPA hosts a collection of historic tables on municipal solid waste generation in America, as well as related scoping studies and research memos.
The 2016 State of Curbside ReportExithas additional information on Curbside Recycling Programs.
U.S. State and Local Waste and Materials Characterization Reports
EPA maintains a list of state and local waste characterization studies; reports are not available for all states. You can search for your state in the table below.
For additions, changes or updates, please send new reports to ORCRMeasurement@epa.gov. Most reports exit EPA’s website.The following links exit the site Exit
- Alabama
- Alaska
- No Report Available
- Arizona
- No Report Available
- Arkansas
- California
- Cal Recycle Data Central (Numerous Characterization Reports and Data)
- California: Alameda County Waste Characterization Study (2008) (PDF) (571 pg, 2.58 MB, About PDF)
- California: Palo Alto Waste Composition Study (2006) (PDF)(94 pp, 365 K, About PDF)
- California: San Francisco Waste Characterization Study (2006) (PDF)(1 pg, 7 K, About PDF)
- California: Statewide Waste Characterization Study (2004)
- California: Statewide Waste Characterization Study (2008)
- Colorado
- Colorado: Boulder County Waste Composition Study (2010) (PDF) (57 pp, 1.66 MB, About PDF)
- Colorado: Larimer County Two-season Waste Composition Study (2007) (PDF)(48 pp, 1.27 MB, About PDF)
- Connecticut
- Delaware
- No Report Available
- District of Columbia
- Florida
- Georgia
- Hawaii
- Idaho
- No Report Available
- Illinois
- Indiana
- Indiana's new waste characterization study (2012) (PDF)(165 pp, 5.78 MB, About PDF)
- Iowa
- Iowa: Statewide Waste Characterization (1998) (PDF)(150 pp, 6.28 MB, About PDF)
- Iowa: Statewide Waste Characterization (2006) (PDF)(170 pp, 1.74 MB, About PDF)
- Iowa: Statewide Waste Characterization Study (2011) (PDF)(135 pp, 1.31 MB, About PDF)
- Kansas
- Kentucky
- No Report Available
- Louisiana
- No Report Available
- Maine
- Maryland
- Massachusetts
- No Report Available
- Michigan
- No Report Available
- Minnesota
- Minnesota: City of Red Wing Solid Waste Composition Study: Solid Waste Boiler Facility (2009) (PDF) (61 pp, 5.32 Mb, About PDF)
- Minnesota: Construction, Demolition, and Industrial Waste Study (2007) (PDF)(159 pp, 1.12 Mb, About PDF)
- Minnesota: Perham Resource Recovery Facility: Solid Waste Composition Study (2012) (PDF) (62 pp, 4.5 Mv, About PDF)
- Minnesota: Solid Waste Composition Study: Covanta Hennepin Energy Resource Company (2012) (PDF) (27 pp, 685 Kb Mb, About PDF)
- Minnesota Statewide Waste Characterization Study (2013) (PDF) (59 pp, 1.66 Mb, About PDF)
- Broader Information on the Minnesota MSW Composition Study
- Mississippi
- No Report Available
- Missouri
- Missouri: Waste Composition Study (2008) (PDF)(112 pp, 2.33 MB, About PDF)
- Montana
- No Report Available
- Nebraska
- Nebraska: State Waste Characterization Study (2009) (PDF)(2175 pp, 6.41 MB, About PDF)
- Nevada
- No Report Available
- New Hampshire
- No Report Available
- New Jersey
- No Report Available
- New Mexico
- No Report Available
- New York
- North Carolina
- North Dakota
- No Report Available
- Ohio
- No Report Available
- Oklahoma
- No Report Available
- Oregon
- Pennsylvania
- No Report Available
- Rhode Island
- No Report Available
- South Carolina
- No Report Available
- South Dakota
- Tennessee
- Texas
- No Report Available
- Utah
- No Report Available
- Vermont
- Vermont: Waste Composition Study (2013) (PDF)(44 pp, 1.47 MB, About PDF)
- Virginia
- No Report Available
- Washington
- Washington: Statewide Waste Characterization Study (2010) (PDF)(135 pp, 2.37 MB About PDF)
- Washington: Thurston County Waste Composition Study (2009) (PDF)(104 pp, 729 K About PDF)
- Washington: Seattle Public Utilities Commission Waste Composition Reports
- Washington: Seattle Public Utilities Residential Waste Stream Composition Study (2010) (PDF)(112 pp, 972 K About PDF)
- King County Monitoring Program, 2007 Waste Characterization Study, June 2008 (PDF)(44 pp, 407 K About PDF)
- West Virginia
- No Report Available
- Wisconsin
- Wyoming
- No Report Available
- International Reports
- Canada - Metro Vancouver Solid Waste Composition Study (2011) (PDF)(167 pp, 5.5 MB About PDF)