SmartWay Trends, Indicators, and Partner Statistics (TIPS)
SmartWay Trends, Indicators, and Partner Statistics (TIPS) is EPA’s resource for leading indicators about freight transportation, supply chain logistics, and quick facts on current SmartWay Partner environmental performance metrics.
Highlights from SmartWay TIPS
Trends, Indicators, and Partner Statistics: Selected TIPS Summarizing SmartWay Partner Data. A collection of selected TIPS from TIPS posted between 2013 and 2015, which were compiled into a booklet for distribution at EPA’s 2015 Vehicle Technology Showcase at the National Vehicle and Fuels Technology Laboratory.
Posted July 29, 2016
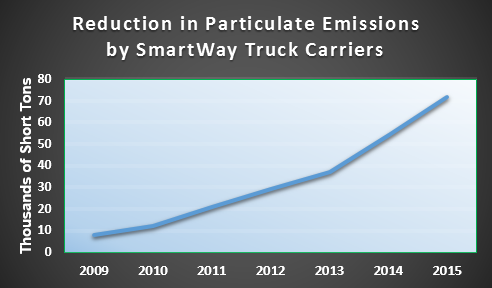
 In addition to reducing fuel consumption and greenhouse gas emissions, SmartWay Partners have also reduced the level of this sector's output of particulate matter (PM) also called "particulate." PM may arise from natural sources like forest fires, or from human activities, like fossil fuel combustion. Air quality data is frequently collected on PM in two size ranges: particles 10 microns in diameter or smaller (PM10), and nested within that category, particles 2.5 microns in diameter or smaller (PM2.5). SmartWay Truck Carrier Partner data submissions between 2009 and 2015 showed cumulative savings of 72,000 tons of PM10.
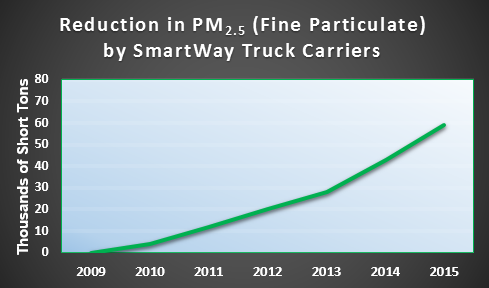
Numerous scientific studies have linked PM exposure to health risks, including heart and lung disease, heart attacks, aggravated asthma, irritation of the airways, coughing, or difficulty breathing. People with heart or lung diseases, children and older adults are the most likely to be affected by PM exposure. (source: /smartway/smartway-trends-indicators-and-partner-statistics-tips) PM is linked to climate change and decreased visibility. Therefore, reducing PM emissions from freight movement plays a critical role in creating and maintaining clear, breathable air and protecting human health. Data reported by SmartWay Truck Carrier Partners between 2009 and 2015 shows a cumulative savings of 59,000 tons of fine particulates (PM2.5). PM2.5 refers to particles 2.5 microns or smaller, also called "fine particles." Why is EPA especially concerned with particles 2.5 microns or smaller?
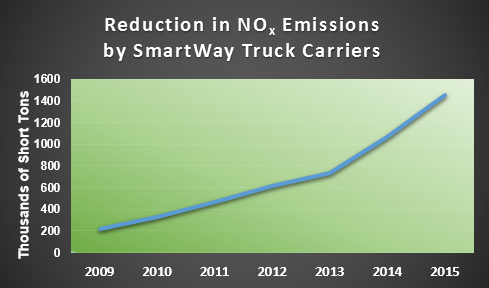
PM2.5 has the same health risks as those described for PM in the previous chart. But the smallest of these particles are potentially even more harmful to the body because they can penetrate deeply into the lungs and become trapped and accumulate there, reducing lung function. Moreover, particles often bear carcinogenic substances. Fine particulates can decrease visibility, causing haze. Fine particulate can travel downwind across long distances, so it can affect air quality far from where it was emitted. Therefore, reducing PM2.5 emissions from freight movement plays a critical role in creating and maintaining clear, breathable air, and protecting human health in this country and around the world. SmartWay Truck Carriers' reports from 2009 through 2015 show cumulatively savings of nearly 1.5 million tons of oxides of nitrogen or "NOx," which here refers to nitric oxide (NO) and nitrogen dioxide (NO2).
NOX is a major ingredient in the creation of ground-level ozone. Ozone exposure is associated with a number of adverse respiratory and cardiovascular effects, which are particularly pronounced among children, the elderly, and among people with lung disease such as asthma. NOX is also a major contributor to PM2.5 formation, which has been linked to a number of adverse health effects, such as heart attacks and premature mortality. In addition, NO2 exposure is linked to asthma attacks and possibly to asthma development in children. NOx also contributes to environmental problems like acid rain and reduced visibility. Therefore, when the freight sector reduces NOx emissions, it reduces acidification of our nation's lakes and streams, damage to wildlife and agriculture, and harm to human health.
EPA compiles and analyzes data from key segments of the freight transport industry and presents it using informative graphics, charts, and statistics, with links to related information. This collection of leading freight transportation facts, current SmartWay Partner performance metrics, and other notable resources related to transportation supply chain sustainability is known as SmartWay Trends, Indicators, and Partner Statistics, or SmartWay TIPS.
SmartWay TIPS provides:
- Freight transportation information relevant to SmartWay Partners, Affiliates, the media, and other stakeholders.
- Data that are not available from any other published sources besides EPA SmartWay.
- Detailed metrics about freight industry performance.
- Snapshots of companies' performance relative to other SmartWay Partners.
Current as of May 9, 2016:
| Partner Type | # of Partners | Affiliate Type | # of Affiliates | Licensee Type | # of Licensees |
|---|---|---|---|---|---|
| Barge Carrier | 4 | (Not specified) | 2 | (Not specified) | 1 |
| Logistics | 551 | Dealership | 70 | OEM | 16 |
| Multimodal | 19 | Leasing Co. | 31 | ||
| Rail Carrier | 19 | Nonprofit | 108 | ||
| Shipper | 255 | Other | 5 | ||
| Truck Carrier | 2,664 | State Trucking Assoc. | 35 | ||
| Truck Stop | 7 | ||||
| Total | 3,512 | Total | 258 | Total | 17 |
Collectively, since 2004, SmartWay Partners have achieved the following:
- Saved $24.9 billion in fuel costs.
- Eliminated 170.3 million barrels of oil—the equivalent of eliminating annual energy use in over 6 million homes.
- Reduced carbon dioxide (CO2) emissions by 72.8 million metric tons.
- Reduced nitrogen oxide (NOx) emissions by 1,458,000 tons.
- Reduced particulate matter (PM) emissions by 59,000 tons.
