EasyRSEI Basics
New users can watch a 20-minute EasyRSEI video tutorial.
EasyRSEI is an easy-to-use application that contains preformatted results for the kinds of releases modeled by EPA's Risk-Screening Environmental Indicators (RSEI) model for all Toxics Release Inventory (TRI) reporting years (1988-2015). With EasyRSEI you can:
- Browse through tables and graphs of rankings and trends.
- Drill down into the data to get more detail on what is driving the results.
- Use the EasyQuery to create your own custom tables.
- Look up RSEI model data on TRI chemicals or reporting facilities.
- Export tables to Microsoft Excel or comma-delimited text files.
Results in EasyRSEI
EasyRSEI contains a number of different results, including:
- TRI Pounds
- Cancer Hazard
- NonCancer Hazard
- RSEI Hazard
- Cancer Score
- NonCancer Score
- RSEI Score
For more information on each kind of result, see understanding RSEI results.
The results in EasyRSEI are aggregated to the facility/release level based on where the results originate (the reporting facility); results for a city or ZIP code include any releases or transfers from facilities in that city or ZIP code, even if those releases result in exposure in another state. RSEI also releases Geographic Microdata (RSEI-GM) results, which aggregate the results based on where the modeled exposure occurs. The RSEI Geographic Microdata page provides more information and instructions on downloading the Geographic Microdata.
EasyRSEI graphs and tables
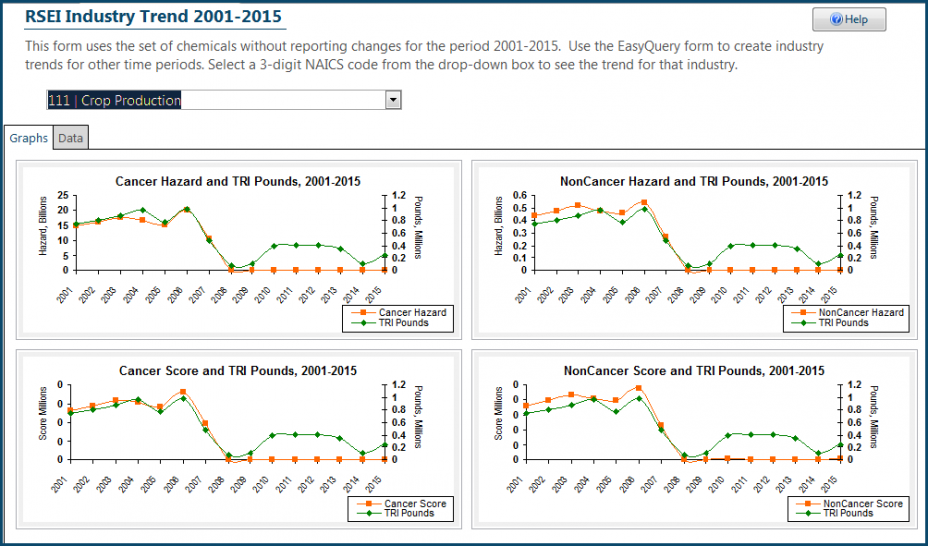
Easy RSEI contains two main sets of preformatted graphs and tables— trends and rankings. Trends follow all national releases or a subset of releases from a certain state, industry, region, or of a certain chemical over a period of time, and are adjusted to remove chemicals that have experienced changes in reporting requirements over the period.
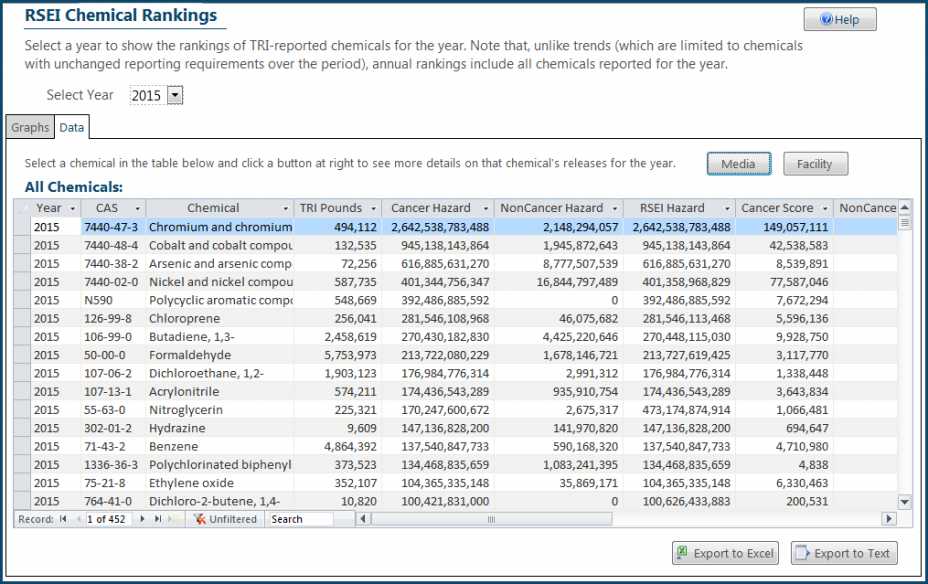
EasyRSEI Rankings show how chemicals, states, regions, industries, or facilities compare against each other in any given year.
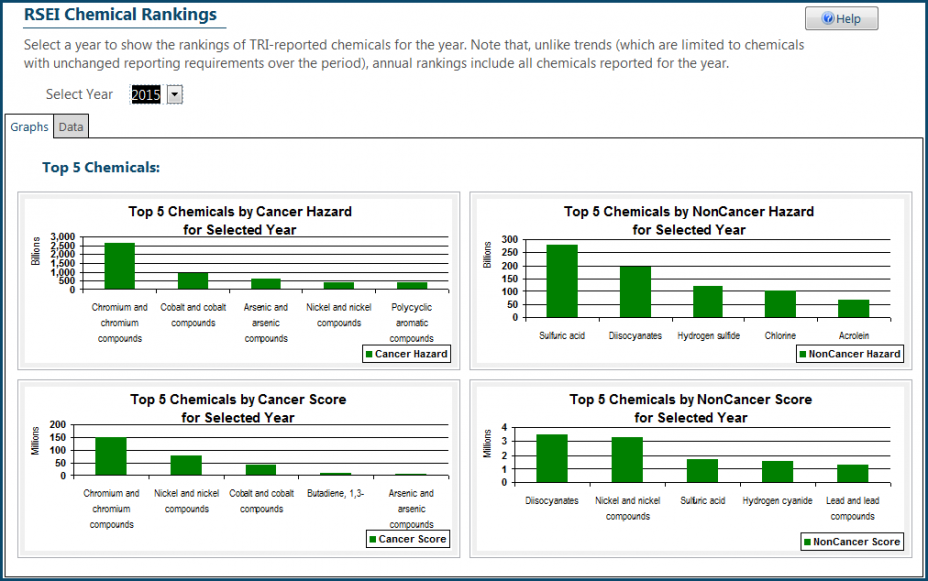
Each EasyRSEI preformatted ranking or trend also contains a data table which shows all of the values for the trend or ranking. Each table can be exported in Microsoft Excel or text format. Also, if you select a row in the table and then click a drill down button, EasyRSEI will open another table that breaks the data down further.