RadNet Air Data From Chicago, IL
RadNet stationary air monitors transmit real-time measurements of gamma radiation each hour to EPA’s National Analytical Radiation Environmental Laboratory (NAREL). The air monitors trap airborne particles on a filter. The filters are typically collected once or twice a week and analyzed at NAREL.
- About RadNet Monitoring Data
- EPA posts monitoring results after checking to ensure they meet quality standards. To view individual data points shown on the graphs below, please use the query tool to search the RadNet database in EPA's Central Data Exchange.
- There may be gaps in the data due to telecommunication disruption, server unavailability, instrument maintenance/repairs, or other technical issues.
- Data are reported in Coordinated Universal Time (UTC). View official U.S. time and other time zones.
- Gamma rates may vary from monitor to monitor, and at one location over time, due to numerous variables including:
- Elevation—cosmic radiation increases with altitude, and changes at a single location due to variations in radiation from the sun and deep space.
- Terrestrial radiation—variability of naturally occurring radionuclides in the soil and building materials near the monitor.
- Changes in weather—rainfall, accumulation and melting of snow, or changes in atmospheric pressure, etc.
- View frequent questions about the RadNet monitoring program.
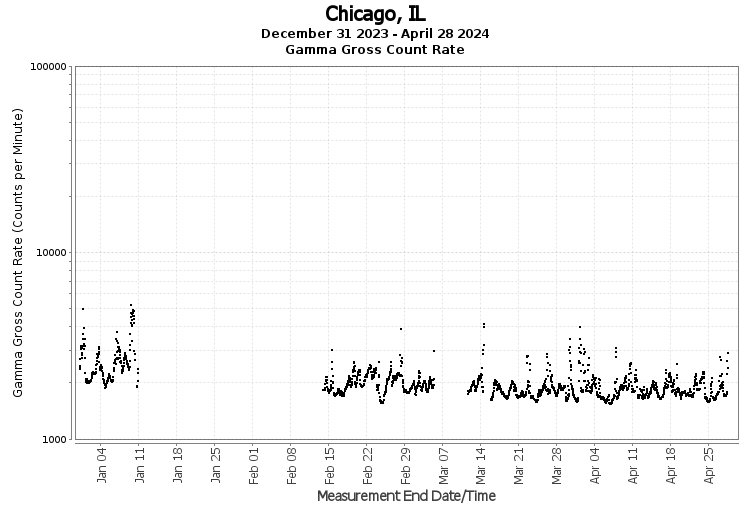
RadNet stationary air monitors measure gamma radiation emitted from airborne radioactive particles as they collect on the monitor's filter. EPA uses RadNet monitors to track fluctuations in gamma ![]() gammaGamma rays come from many different radioactive elements, both natural and man-made. Gamma rays can penetrate several feet of concrete or a few inches of lead. Gamma rays can pose a serious health threat inside and outside the body and can be lethal depending on the amount received. Scientists use the properties of gamma rays to identify radioactive elements. radiation emitted from airborne radioactive particles at each of our sites. Tracking these changes over time gives a picture of the background (normal) levels and allows EPA scientists to detect any unusual changes.
gammaGamma rays come from many different radioactive elements, both natural and man-made. Gamma rays can penetrate several feet of concrete or a few inches of lead. Gamma rays can pose a serious health threat inside and outside the body and can be lethal depending on the amount received. Scientists use the properties of gamma rays to identify radioactive elements. radiation emitted from airborne radioactive particles at each of our sites. Tracking these changes over time gives a picture of the background (normal) levels and allows EPA scientists to detect any unusual changes.
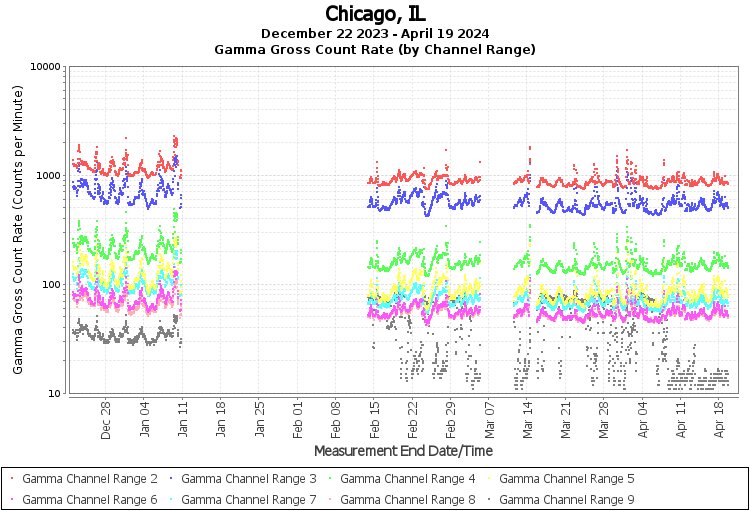
You can see a more detailed view of gamma detection across nine different energy ranges in our Gamma Gross Count Rate (by Energy Range) Graph.
About the Gamma Gross Count Rate Graph
- The Gamma Gross Count Rate represents how many gamma rays the monitor detects each minute.
- To view the individual data points shown on this graph, please use the query tool to search the RadNet database in EPA's Central Data Exchange.
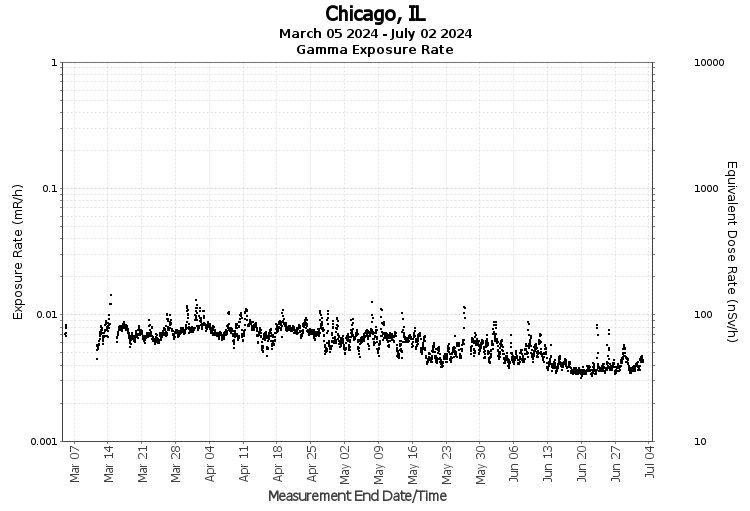
In an effort to make RadNet radiation data more understandable to the public and easier to compare with international data, EPA is adding exposure rate measurements to our other system capabilities. Exposure rate measurements indicate the level of radiation present per hour in the vicinity of the monitor.
About the Exposure Rate Graph
- Chicago, IL began reporting exposure rate data on November 14, 2016.
- The left axis of the graph shows gamma exposure rate in US units of milliRoentgen per hour (mR/h). The right axis shows equivalent dose rate in the international units of nanoSieverts per hour (nSv/h), which is provided for easy comparison with international monitoring stations.
- To learn about typical dose rates, view About Exposure and Dose Rates.
The air filters used in RadNet monitors are typically collected once or twice a week and are sent to EPA’s National Analytical Radiation Environmental Laboratory. Upon arrival, accepted RadNet air filters are initially analyzed to determine gross![]() grossTotal activity from all emitters (alpha or beta). beta air concentrations. Visit Envirofacts to view gross beta analysis results. If the initial gross beta analysis shows a level greater than 1 pCi/m3, gamma spectrometry results are viewable in the Radionuclide Analysis Results table below. Additional nuclide specific analyses may also be performed.
grossTotal activity from all emitters (alpha or beta). beta air concentrations. Visit Envirofacts to view gross beta analysis results. If the initial gross beta analysis shows a level greater than 1 pCi/m3, gamma spectrometry results are viewable in the Radionuclide Analysis Results table below. Additional nuclide specific analyses may also be performed.
Beginning in 2015, composite samples of the air filters for each monitor are analyzed for gamma-emitting radionuclides. Plutonium (Pu-238, Pu-239/Pu-240) and uranium (U-234, U-235, and U-238) alpha![]() alpha Alpha particles come from heavy radioactive elements such as uranium, radium and polonium. They can be stopped by a thin layer of light material, such as a sheet of paper, and cannot penetrate the outer, dead layer of skin. Therefore, they do not damage living tissue when outside the body. However, they can damage living tissue and pose a serious health threat if swallowed or inhaled. spectrometry analyses are performed on the composite sample
alpha Alpha particles come from heavy radioactive elements such as uranium, radium and polonium. They can be stopped by a thin layer of light material, such as a sheet of paper, and cannot penetrate the outer, dead layer of skin. Therefore, they do not damage living tissue when outside the body. However, they can damage living tissue and pose a serious health threat if swallowed or inhaled. spectrometry analyses are performed on the composite sample![]() composite sample A collection of individual samples obtained at regular intervals, usually every one or two hours during a 24-hour time span. Each individual sample is combined with the others in proportion to the rate of flow when the sample was collected. The resulting mixture (composite sample) forms a representative sample and is analyzed to determine the average conditions during the sampling period. from one-fourth of the stations on a four-year rotating schedule. These results are viewable in the Americium, Plutonium and Uranium Results table below.
composite sample A collection of individual samples obtained at regular intervals, usually every one or two hours during a 24-hour time span. Each individual sample is combined with the others in proportion to the rate of flow when the sample was collected. The resulting mixture (composite sample) forms a representative sample and is analyzed to determine the average conditions during the sampling period. from one-fourth of the stations on a four-year rotating schedule. These results are viewable in the Americium, Plutonium and Uranium Results table below.
Prior to 2015, a composite samples of air filters for each monitor was analyzed for plutonium (Pu-238, Pu-239/Pu-240) and uranium (U-234, U-235, and U-238) by alpha spectrometry analyses. These results are viewable in the Americium, Plutonium and Uranium Results table below.
In the case of a known or expected release, additional analyses may be performed.
Radionuclide Analysis Results
Columns are sortable. See results key below.
Americium, Plutonium and Uranium Results
Columns are sortable. See event key below.
| Results Key | ||
|---|---|---|
|
Non-Detect |
The radionuclide was not detected with 97.5% confidence. Either no result was measured or a result was less than twice the uncertainty level. |
|
|
Not Analyzed |
The sample was not tested for this radionuclide |
|
| Event Key | ||
|---|---|---|
|
Non-Event |
These air filters are not associated with any large scale radiological incident. |
|
|
Composite |
At the end of each year, scientists combine all the air filters for each monitor and run gamma analyses. Alpha analyses are performed on the composites from one-fourth of the stations on a four-year rotating schedule. |
|
|
Event A |
Chernobyl, Ukraine |
These air filters were analyzed in the 90 days following the Chernobyl Nuclear Power Plant incident. The results are not necessarily related to this event. |
|
Event B |
Tokaimura, Japan |
These air filters were analyzed in the 90 days following the Tokaimura Nuclear Reactor accident. The results are not necessarily related to this event. |
|
Event C |
Los Alamos, |
These air filters were analyzed in the 90 days following the Cerro Grande fire, which threatened a historically contaminated site. The results are not necessarily related to this event. |
|
Event D |
Hanford, |
These air filters were analyzed in the 90 days following the fires at the Hanford Nuclear Reservation. The results are not necessarily related to this event. |
|
Event E |
Fukushima, Japan |
These air filters were analyzed in the 90 days following the tsunami that damaged the Fukushima Daiichi Nuclear Power Plant. The results are not necessarily related to this event. |
|
Event F |
Los Alamos, |
These air filters were analyzed in the 90 days following the Las Conchas fire, which threatened a historically contaminated site. The results are not necessarily related to this event. |
Note: All results (activity concentrations) have been radioactive decay corrected back to the sample collection end date/time (UTC).