Financing Strategies Used by the National Estuary Program
On average, the National Estuary Programs (NEPs) raise $18 for every $1 provided by EPA. The NEPs successfully leverage federal seed money by:
- developing finance plans
- building strategic alliances
- demonstrating environmental results
- providing seed money or staff to initiate and develop new funding sources such as stormwater utilities

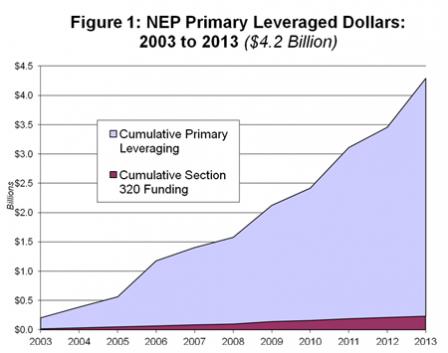
Over the 2003-2013 period, the NEPs leveraged $4.2 billion from $230 million in EPA grants. This additional funding came from a variety of federal, state, local and private sources through such mechanisms as:
- annual membership appeals
- license plate revenues
- fines and penalties
- state appropriations
- intergovernmental agreements
There are many sustainable funding examples from the NEPs.

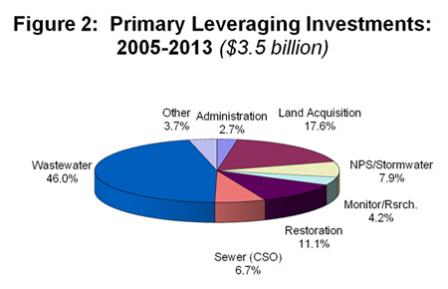
The NEPs use leveraged resources to:
- protect and restore important habitat
- support critical land acquisitions
- upgrade wastewater and stormwater infrastructure
- conduct outreach and education
- implement other priority actions contained in their Comprehensive Conservation and Management Plans (CCMP).
Note: Leveraged dollars are defined as the dollar value (cash or in-kind equivalent) of resources dedicated to implementing an NEP CCMP above and beyond the funding provided to the NEP under Section 320, including earmark funding. "Primary” leveraging indicates that the NEP Director and staff, rather than NEP partners, played the central or leadership role in obtaining the additional resources.
