Remote Sensing Information Gateway
The Remote Sensing Information Gateway (RSIG) allows for quick and easy access to subsets of multi-terabyte environmental datasets, including satellite, modeled, and in-situ sensor data. The old process of downloading and parsing data (taking days, weeks, or months) is reduced to minutes with RSIG.
There are two different user interfaces to RSIG. The first, RSIG2D, is a Java applet which runs inside your web browser. To use it, simply click "Launch RSIG2D Applet" in the Quick Links. You will need to have Java enabled in your browser. See the "Tips for Running RSIG" Quick Link for help.
The second and newest user interface is RSIG3D. It is a standalone application which must first be downloaded to your computer and unzipped. It offers the same basic subsetting functionality as RSIG2D, while also providing a richly immersive and interactive visualization capability.
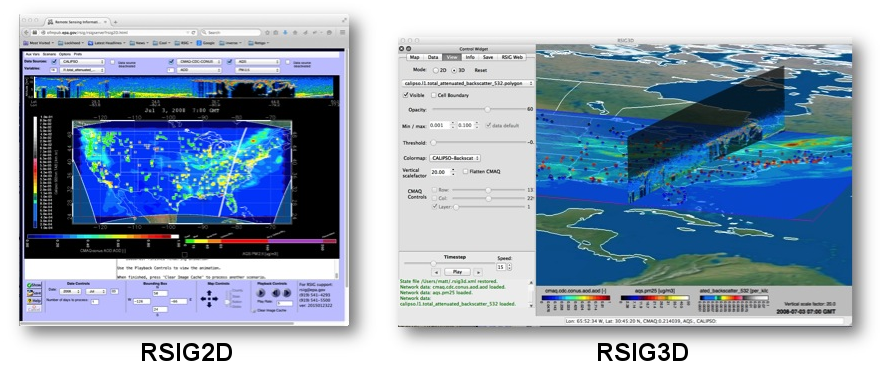
About RSIG
With RSIG, the user can tap into a wide range of key environmental models and data, such as NASA's Moderate Resolution Imaging Spectroradiometer (MODIS), the Environmental Protection Agency's (EPA) Community Multi-scale Air Quality (CMAQ) model output, National Environmental Satellite, Data, and Information Service (NESDIS) biomass burning data, and ground station measurements from AIRNow and EPA's Air Quality System (AQS). RSIG also enables users to integrate their selected datasets into a unified visualization.
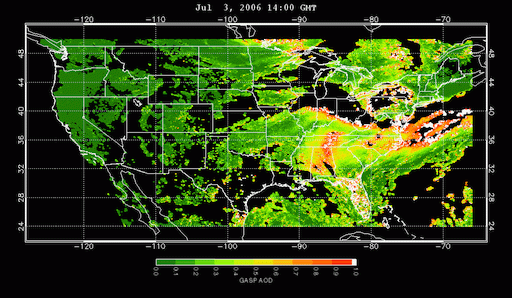 GOES-GASP Geostationary US-coverage satellite 4km Aerosol Optical Depth data.
Currently, RSIG focuses on atmospheric data, but it can be extended to support other types of geospatial data. A list of available datasets accessible via RSIG is available on this site.
The benefit to users and consumers of environmental data is fast acquisition of only the data they want to see and in a standard format they can save to their desktop PC.
RSIG's Key Features
- One access point to many data sources. The RSIG provides a single Web site that serves as a selective access point to many kinds of data.
- Streams only the needed data. The RSIG accesses large numbers of files from diverse sources and streams the user-selected subset of data back to the user's desktop. Streaming works in the same way as streaming audio works on the Web: the data goes directly to the client computer's memory and is discarded unless the user saves it to a file.
- Aggregates separate data files into a single stream. RSIG aggregates the multiple files of a given data type into a single stream, reducing the download burden and simplifying data analysis.
- Built-in visualization. RSIG can immediately integrate multiple selected datasets into a single MPEG animation. For example, EPA AIRNow data can be layered over NASA's MODIS satellite data, or a user can compare CMAQ predicted outputs and actual ground sensor data. The user can also save the animation or individual images to their computer.
- Saves data to standard formats. RSIG integrates incoming proprietary dataset formats into standard formats the user can save on their computer. A user can save the data or visualization--or both--to their local computer in such standard formats as portable binary, ASCII, NetCDF IOAPI and COARDS, GeoTIFF, MPEG and KMZ. The user can then export the selected datasets from RSIG into other applications--such as GIS tools--for further analysis
- Fast. RSIG accomplishes all of this far faster than a lone user could with currently available means. For example, RSIG can capture a week of MODIS AOD data in a few minutes, compared to two months using conventional web-form ordering/ftp approaches.
RSIG: Data and Visualizations
NEUBrew (NOAA-EPA Brewer Spectrophotometer UV and Ozone Network) ozone profile data.
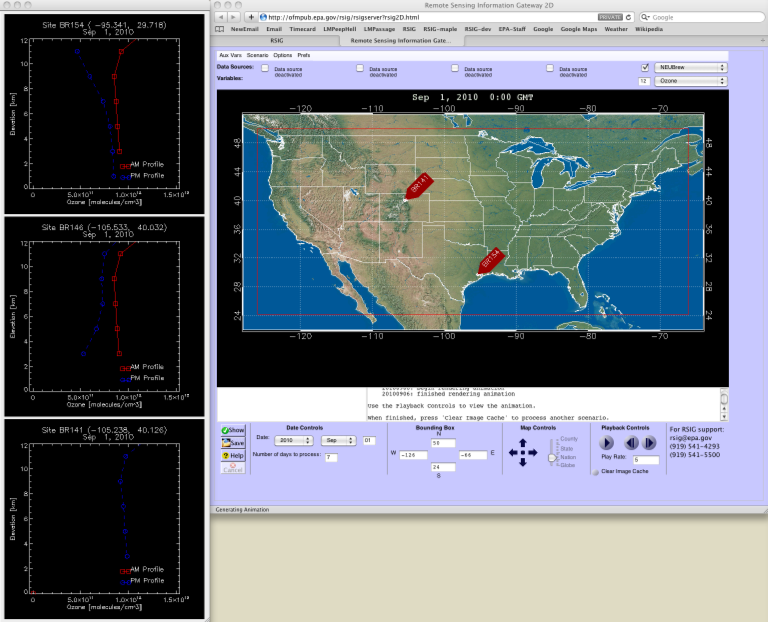
(Click image for larger view.)
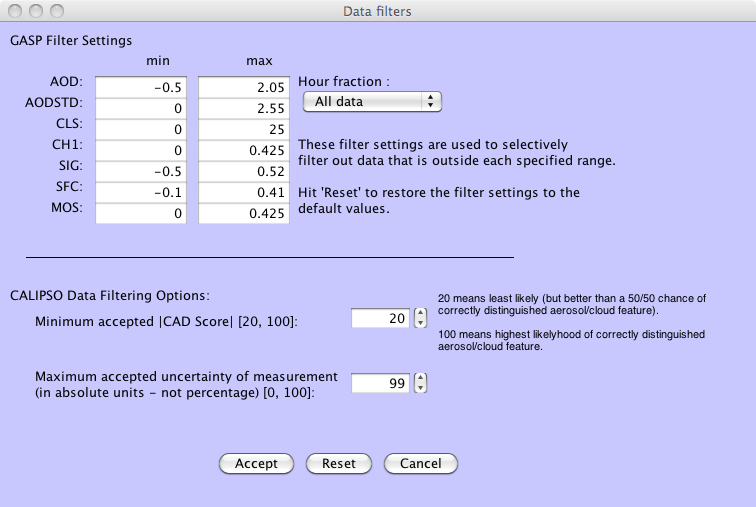
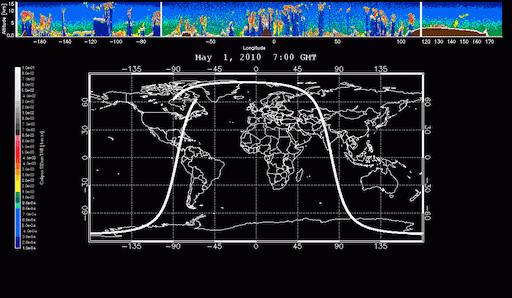
CALIPSO Level-2 5km Aerosol and Cloud Profiles.
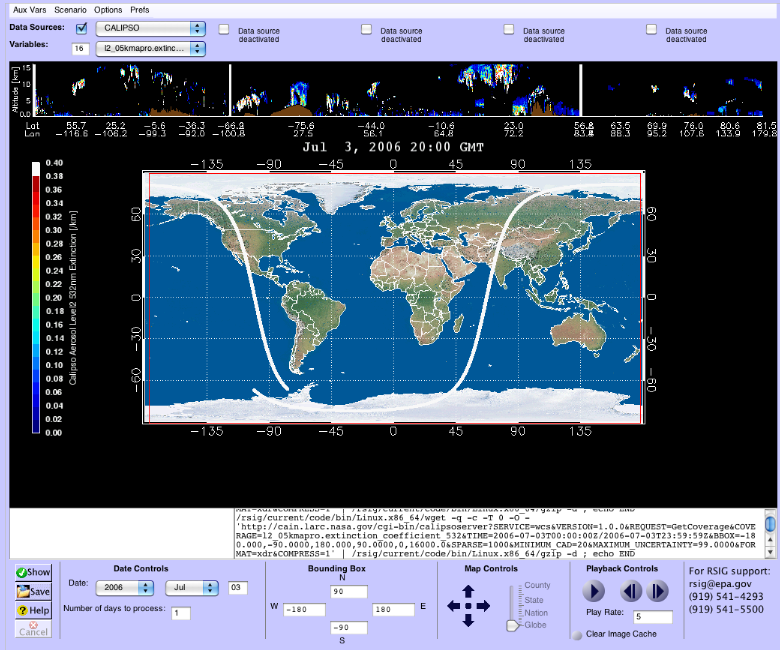
(Click image for larger view.)
With additional data-filtering options.
(Click image for larger view.)
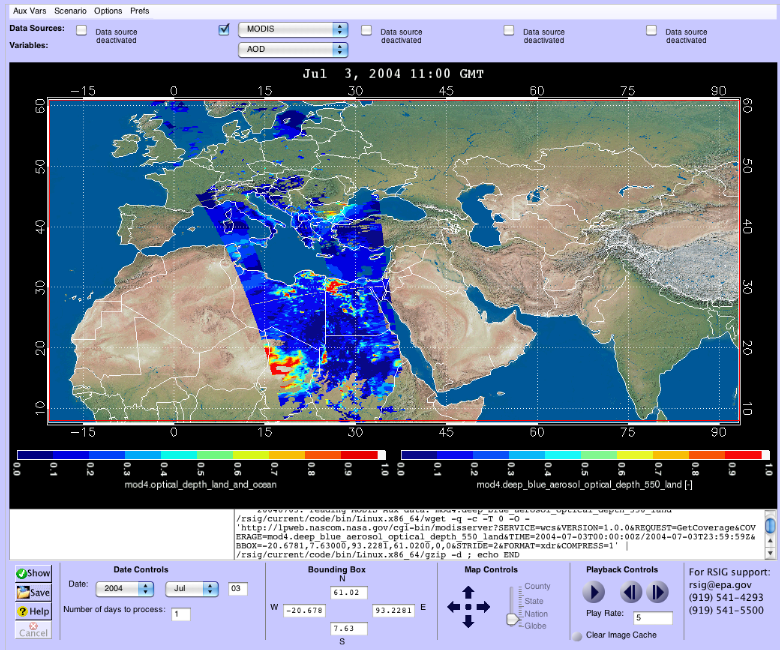
And MODIS Level-2 10km "Deep Blue" Aerosol Optical Depth (over sand / high-reflectance).
(Click image for larger view.)
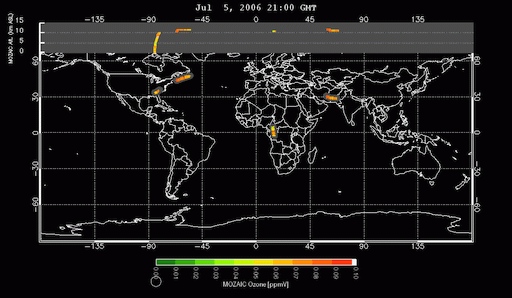
MOZAIC European-based global commercial aircraft flight measured ozone, CO, NO data MOZAIC Exit (currently under restricted access pending an agreement between EPA and European scientists).
(Click image for larger view.)
(Click image for larger view.)
GOES-GASP Geostationary US-coverage satellite 4km Aerosol Optical Depth data.
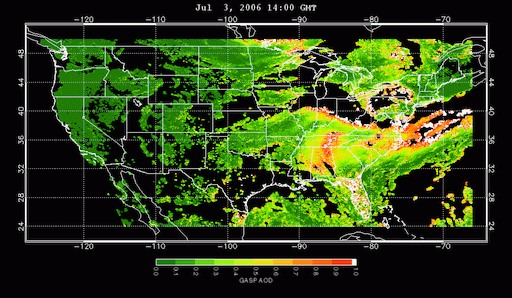
(Click image for larger view.)
Comparison (difference, absolute difference, percent difference, ratio, after regridding) of Ozone, AOD, PM25 from MODIS, FAQSD, GASP, MOZAIC, Airnow and AQS to CMAQ.
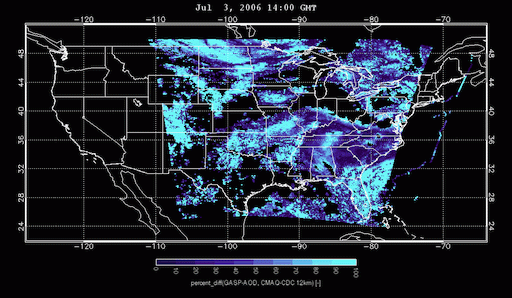
(Click image for larger view.)
Intersection of CALIPSO and MOZAIC 4D path in CMAQ grid. I.e., extract CMAQ data for each lon-lat-elevation-time of the other data.
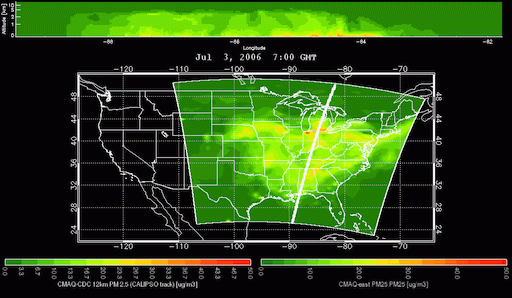
(Click image for larger view.)
AQS ground station measured data: SO2, Temperature and Relative Humidity.
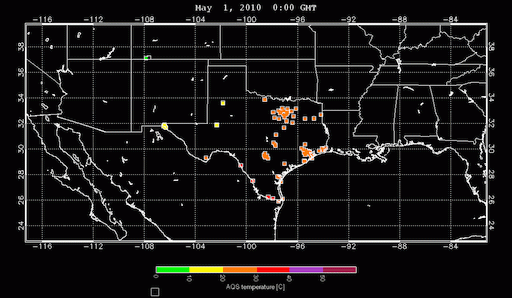
(Click image for larger view.)
Access to April 2010 collection 5.1 MODIS L2 data. (Icelandic volcano plume shown.)
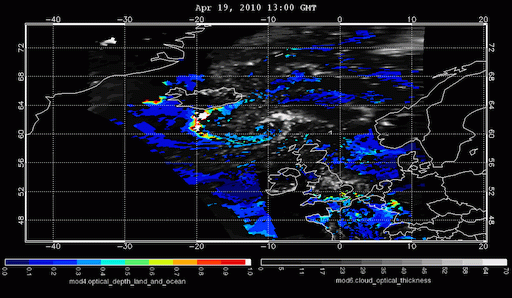
(Click image for larger view.)
RSIG's Architecture
This poster describes in detail RSIG's flexible and extensible architecture. The architecture enables RSIG to serve many types of data with an emphasis on convenience, high-performance, data integrity, and security. Depending on the speed of your connection, the poster may take a few seconds to load for viewing.


