U.S. Government Global Methane Initiative Accomplishments
 The U.S. government plays an important role in reducing international methane emissions and promoting methane recovery and use projects around the world. This report summarizes U.S. government agencies’ Fiscal Year 2015 (FY2015) contributions and highlights 2015 activities.
The U.S. Government's International Methane Emission Reduction Activities: 2015 Accomplishments report summaries of the U.S. government’s methane emission reduction accomplishments throughout the world, and also features sector-specific activity highlights during FY 2015.
- Read the 2016 U.S. Government's Global Methane Initiative Accomplishments report
- Read reports from previous years: 2015, 2014, 2013, 2012, 2011, 2010, 2009, 2008, 2007, 2006
2016 Report Highlights
In 2015, the United States:
- Supported approximately 100 international methane emission reduction activities.
- Supported international efforts that yielded actual annual emission reductions totaling approximately 30 MMTCO2E.
U.S. Government Funding and Leveraged Funding, FY 2005-FY 2015
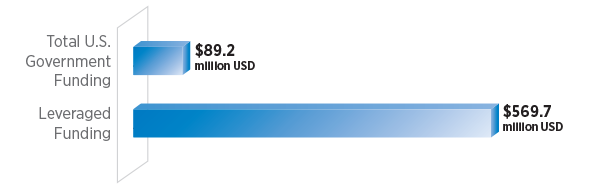 U.S. government funding for international methane emission reduction activities from FY 2005 through FY 2015 totaled more than $89 million. This has helped leverage nearly $570 million in funding from other sources, such as the World Bank.
FY 2015 U.S. Expenditures by Region
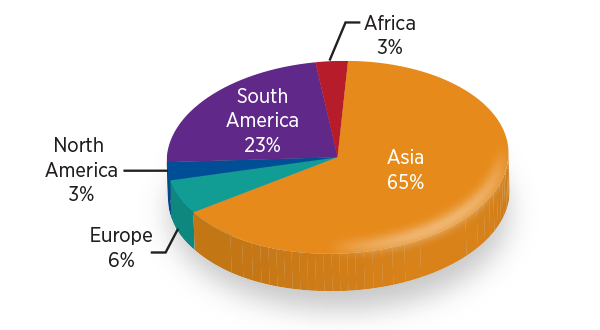 In 2015, the U.S. government supported approximately 100 international methane emission reduction activities including assessments, capacity building, and information sharing in more than a dozen Partner Countries in Africa, Asia, Europe, and North and South America.
FY 2015 U.S. Expenditures by Activity
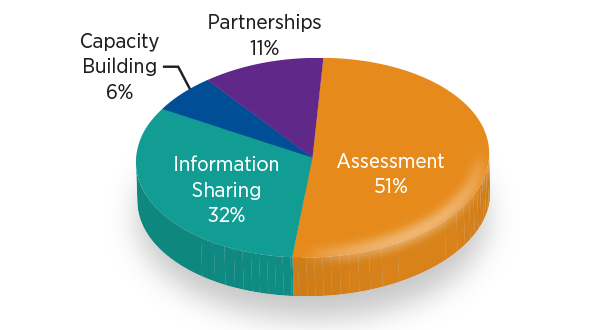 Activities included assessment (pre-feasibility and measurement field studies), capacity-building activities (technical workshops to disseminate sector-specific best practices, study tours to demonstrate these best practices in action), partnerships, and information sharing (attending subcommittee meetings within each sector, conferences, participating in various stakeholder meetings) around the world.
Annual Methane Emission Reduction from U.S.-Supported Projects, 2005-2015
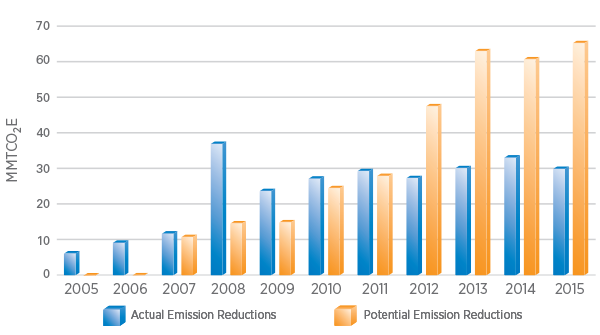 With assistance from several agencies—particularly the U.S. Environmental Protection Agency (EPA) and U.S. State Department— the U.S. government is supporting approximately 1,000 ongoing methane emission reduction projects around the world. In 2015, these projects avoided actual methane emissions of approximately 30 MMTCO2E. The United States also identified projects with “potential” emissions reductions that could be realized if implemented.