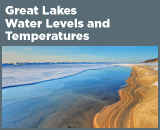
Climate Change Indicators: Great Lakes Water Levels and Temperatures
This indicator measures water levels and surface water temperatures in the Great Lakes.
-

This figure displays how water levels in each of the Great Lakes have changed since 1860. For each year, the shaded band shows the range of monthly average water levels, and the line in the middle shows the annual average. The graph uses the 1981 to 2010 average as a baseline for depicting change. Choosing a different baseline period would not change the shape of the data over time. Lakes Michigan and Huron are shown together because they are connected at the same water level.
Data source: NOAA, 20166
Web update: August 2016 -

This figure shows the average surface water temperatures in each of the Great Lakes, as measured by satellites. The graphs on the left show annual averages for the full time period, while the graphs on the right show how average daily temperatures have changed between two time periods for comparison: 2006–2015 versus 1995–2004.
Data source: NOAA, 20167
Web update: August 2016


Key Points
- Water levels in the Great Lakes have fluctuated since 1860. Over the last few decades, they appear to have declined for most of the Great Lakes (see Figure 1). The most recent levels, however, are all within the range of historical variation.
- Since 1995, average surface water temperatures have increased slightly for each of the Great Lakes (see Figure 2).
- Recent increases in water temperature have mostly been driven by warming during the spring and summer months (see Figure 2). These trends could relate in part to an earlier thawing of winter ice (see the Lake Ice indicator).
Background
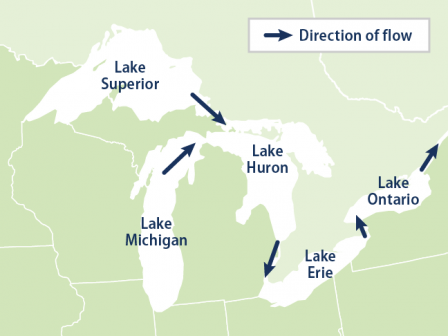 The Great Lakes, which are Lake Superior, Lake Michigan, Lake Huron, Lake Erie, and Lake Ontario, form the largest group of freshwater lakes on Earth. These lakes support a variety of ecosystems and play a vital role in the economy of the eight neighboring states and the Canadian province of Ontario, providing drinking water, shipping lanes, fisheries, recreational opportunities, and more.
Water level and water temperature are two important and interrelated indicators of weather and climate change in the Great Lakes. Water level (the height of the lake surface above sea level) is influenced by many factors, including precipitation, snowmelt runoff, drought, evaporation rates, and people withdrawing water for multiple uses. Water temperature is influenced by many factors, too, but most directly by air temperature.
In recent years, warmer surface water temperatures in the Great Lakes have contributed to lower water levels by increasing rates of evaporation and causing lake ice to form later than usual (see the Lake Ice indicator), which extends the season for evaporation.1 Lower water levels in the Great Lakes forced ships to reduce their cargo tonnage by 5 to 8 percent between 1997 and 2000, which increased shipping costs. Lower water levels can also affect water supplies, the usability of infrastructure such as docks and piers, and shoreline ecosystems. These types of disruptions from low water levels are expected to continue as the climate changes.2
Another possible effect of warmer water, reduced ice cover, and increased evaporation is a corresponding increase in precipitation over nearby land, especially “lake effect” snow (see the Snowfall indicator).3 Rising water temperatures are also expected to expand the ranges of and give new advantages to some invasive species such as the zebra mussel, and to encourage the growth of certain waterborne bacteria that can make people ill.4,5
About the Indicator
This indicator analyzes water levels and surface water temperatures in the Great Lakes. Water levels are recorded by gauges along the shore of each lake, some of which have been operated since the 1800s. Pre-1918 data came from one water level gauge per lake. Data since 1918 have come from a designated set of gauges in each lake. Figure 1 shows annual water level anomalies, or differences, in feet compared with the average water levels in each lake from 1860 to 2015. Lakes Michigan and Huron are combined because they are connected at the same water level.
Surface water temperatures are measured by satellites. Figure 2 shows annual average temperatures over the entire surface of each lake, along with the pattern of daily temperatures over the course of the year. This figure’s data begin in 1995, which was the first year with complete satellite data for all five lakes.
Indicator Notes
While climate change influences water levels, human activities such as dredging can also play a role. For example, the St. Clair river opening was enlarged in the 1910s, 1930s, and 1960s, contributing to greater outflows from Lakes Michigan and Huron.8 Similarly, natural year-to-year variability and other factors such as human use and wastewater discharges can influence water temperatures.
Data Sources
Water level data were provided by the Canadian Hydrographic Service and the National Oceanic and Atmospheric Administration’s Center for Operational Oceanographic Products and Services, and can be downloaded from: www.glerl.noaa.gov/data/dashboard/data. Surface water temperature data were provided by the National Oceanic and Atmospheric Administration’s Great Lakes Environmental Research Laboratory (satellite data at: https://coastwatch.glerl.noaa.gov).
Technical Documentation
References
1 Gronewold, A.D., V. Fortin, B. Lofgren, A. Clites, C.A. Stow, and F. Quinn. 2013. Coasts, water levels, and climate change: A Great Lakes perspective. Climatic Change 120:697–711.
2 Posey, J. 2012. Climate change impacts on transportation in the Midwest. U.S. National Climate Assessment, Midwest Technical Input Report.
3 Burnett, A.W., M.E. Kirby, H.T. Mullins, and W.P. Patterson. 2003. Increasing Great Lake-effect snowfall during the twentieth century: A regional response to global warming? J. Climate 16:3535–3542.
4 Rahel, F.J., and J.D. Olden. 2008. Assessing the effects of climate change on aquatic invasive species. Conserv. Biol. 22(3):521–533.
5 Kanoshima, I., L. Urmas, and J.-M. Leppanen. 2003. The influence of weather conditions (temperature and wind) on cyanobacterial bloom development in the Gulf of Finland (Baltic Sea). Harmful Algae 2:29–41.
6 NOAA (National Oceanic and Atmospheric Administration). 2016. Great Lakes water level observations. Accessed April 2016. www.glerl.noaa.gov/data/dashboard/data.
7 NOAA (National Oceanic and Atmospheric Administration). 2016. NOAA CoastWatch, Great Lakes node. Accessed February 2016. https://coastwatch.glerl.noaa.gov/.
8 Quinn, F.H. 1985. Temporal effects of St. Clair River dredging on Lakes St. Clair and Erie water levels and connecting channel flow. J. Great Lakes Res. 11(3):400–403.
Learn about other indicators in this section