Coastal Property Impacts: Environmental Justice
Building on the coastal property impacts described in the previous section, this analysis examines the environmental justice implications of projected sea level rise and storm surge in the contiguous U.S. Specifically, the approach quantifies how sea level rise and storm surge risks are distributed across different socioeconomic populations along the U.S. coastline; how these populations are likely to respond; and what adaptation costs (i.e., property damage and protection investments) will potentially be incurred.
On this page:
Additional information:
The Social Vulnerability Index
-
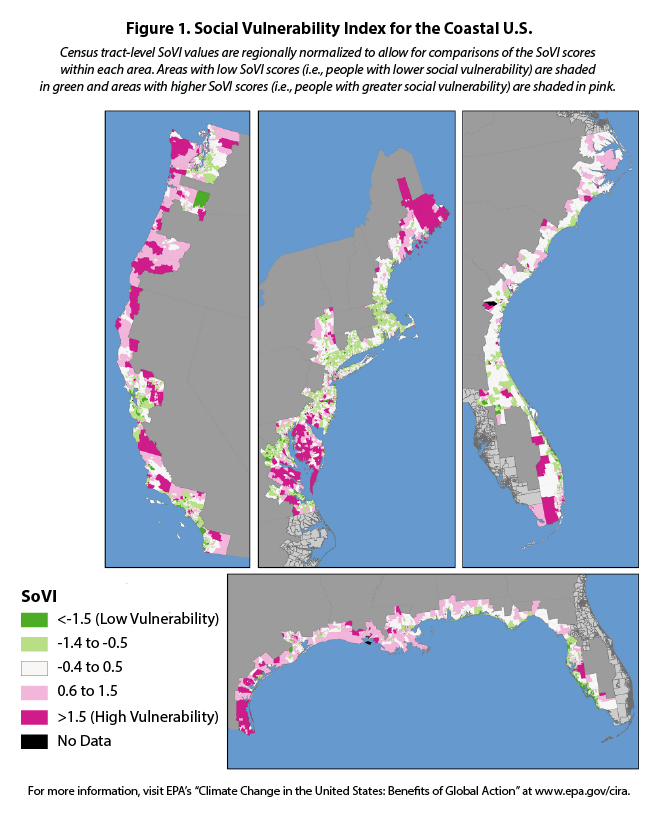
The CIRA analysis uses the Social Vulnerability Index (SoVI) to identify socially vulnerable coastal communities in the U.S.39 SoVI was developed to quantify social vulnerability using county-level (and later Census tract-level) socioeconomic and demographic data. The index is a well-vetted tool, and does not include any environmental risk factors, thereby eliminating the risk of double counting climate risk when socioeconomic and demographic data are combined with sea level rise and storm surge vulnerability.40 The CIRA analysis uses Census tract-level SoVI values based on 2000 Census data for 26 demographic variables, capturing information on wealth, gender, age, race, and employment. Figure 1 shows the SoVI index values for the four coastal regions used in the analysis: Pacific (California through Washington), North Atlantic (Maine through Virginia), South Atlantic (North Carolina through Monroe County, Florida), and Gulf (Collier County, Florida through Texas).
Figure 1. Social Vulnerability Index for the Coastal U.S.
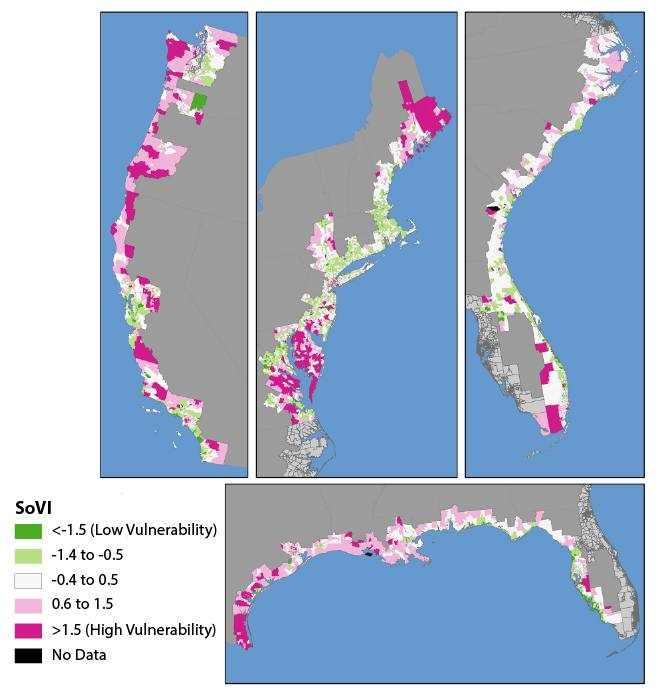 Census tract-level SoVI values are regionally normalized to allow for comparisons of the SoVI scores within each area. Areas with low SoVI scores (i.e., people with lower social vulnerability) are shaded in green and areas with higher SoVI scores (i.e., people with greater social vulnerability) are shaded in pink.
download the figure; download the data
Case Study: Tampa Bay Area
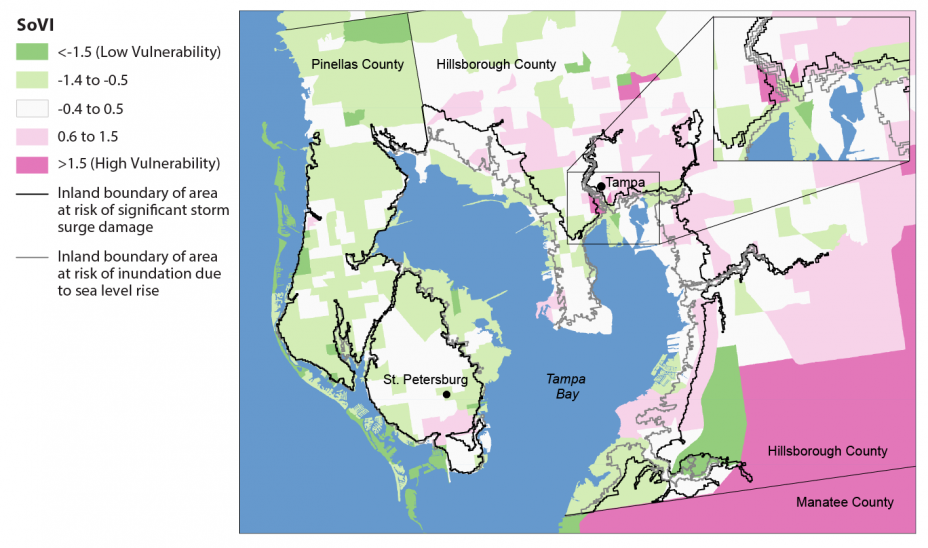
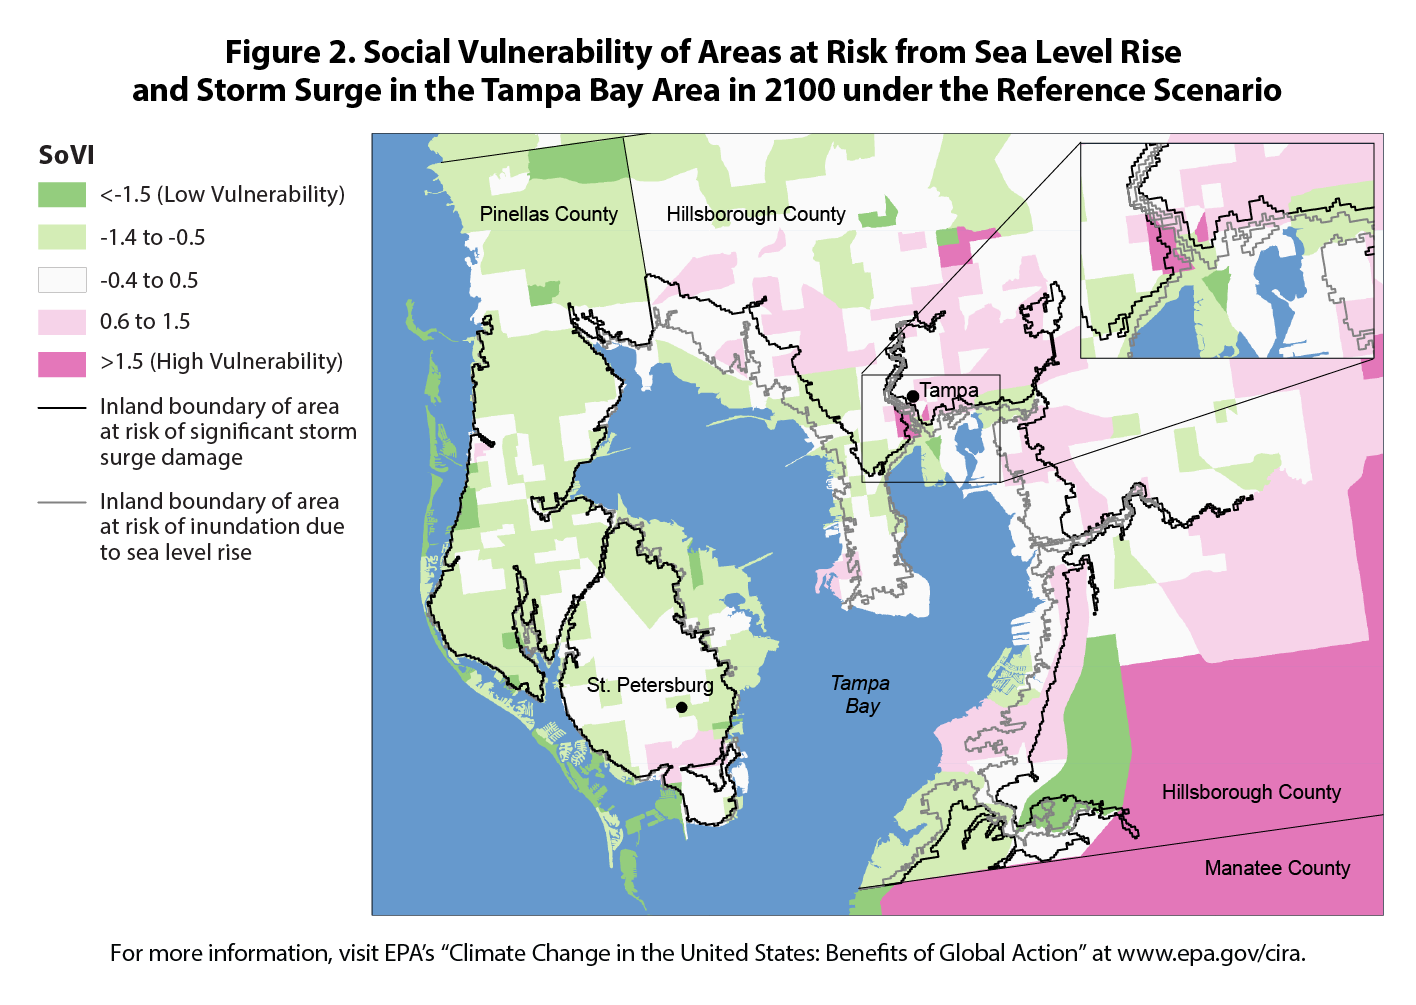
EPA’s National Coastal Property Model identifies areas along the contiguous U.S. coastline that are likely to be at risk from sea level rise and storm surge through 2100.41, 42 By layering these projections on top of the SoVI results, following the approach described in Martinich et al. (2013),43 the analysis assesses the potential impact of sea level rise and storm surge on socially disadvantaged populations in coastal areas. Figure 2 presents a case study of the Tampa Bay, Florida area (Pinellas and Hillsborough Counties). The area from the water to the gray lines represents the projected area at risk of inundation due to sea level rise, while the area from the water to the black lines represents projected areas at risk from significant storm surge damage in 2100.44 As shown, there are areas with higher socially vulnerable populations (pink shading) near the city of Tampa, in particular, that are projected to be at risk of significant storm surge damages.
Figure 2. Social Vulnerability of Areas at Risk from Sea Level Rise and Storm Surge in the Tampa Bay Area in 2100 under the Reference Scenario
 download the figure; download the data
National Results
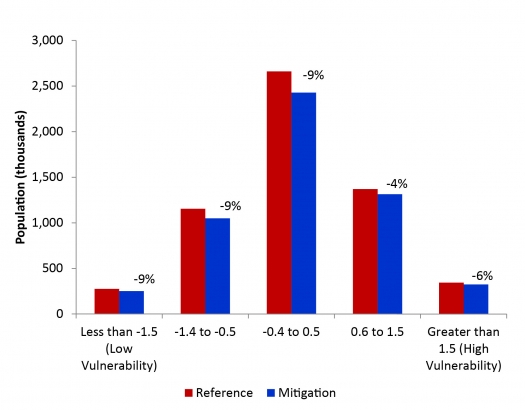
Figure 3 compares the number of people in the 17 multi-county coastal areas (see previous section for locations) identified as at risk due to climate change under the Reference and Mitigation scenarios, by SoVI category. As shown, the Mitigation scenario reduces the number of at-risk people compared to the Reference scenario for all SoVI categories. In the most vulnerable SoVI categories (0.6-1.5 and greater than 1.5), global GHG mitigation is projected to reduce the number of at-risk people by approximately 77,000 through 2100.
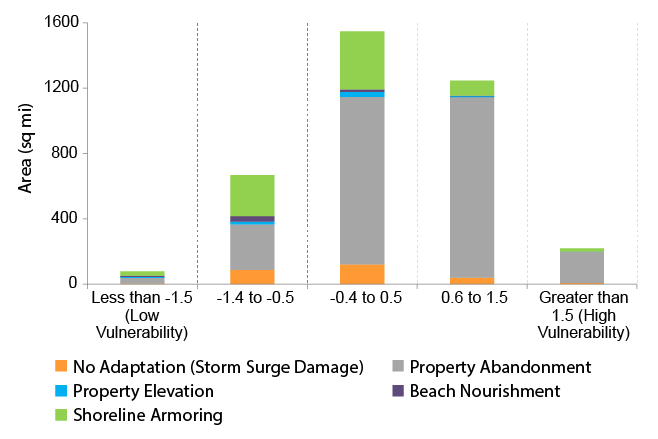
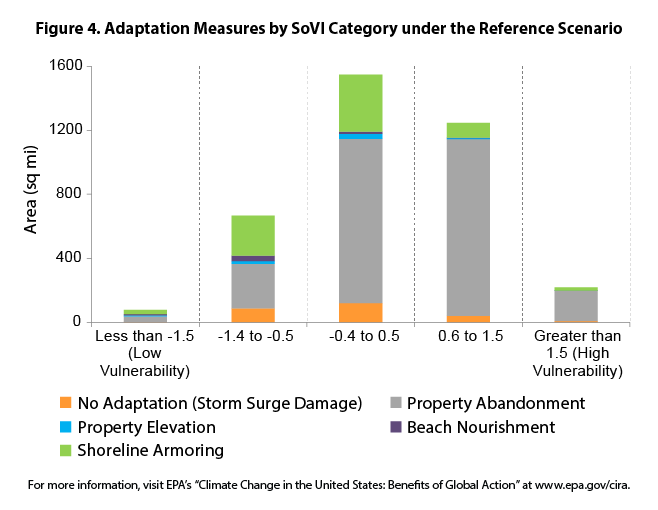
The CIRA analysis also projects adaptation responses based on sea level rise, storm surge height, property value, and costs of adaptation.45 The model estimates whether people living in coastal areas are likely to respond to climate threats by: 1) protecting property through beach nourishment, property elevation, or shoreline armoring; 2) abandoning property; or 3) incurring storm surge damages without adapting. Figure 4 presents the adaptation results, by area, for the five SoVI categories in the Reference. More area is likely to be abandoned than protected across all social vulnerability categories. However, in the most vulnerable SoVI categories (0.6-1.5 and greater than 1.5), a relatively larger proportion of the area inhabited is likely to be abandoned (89% and 86%, respectively) rather than protected through adaptation measures (8% and 10%, respectively).
Figure 3. Social Vulnerability of Populations at Risk from Sea Level Rise and Storm Surge through 2100 with and without Global GHG Mitigation