Climate Action Benefits: Methods of Analysis
This report summarizes and communicates the results of EPA’s ongoing Climate Change Impacts and Risk Analysis (CIRA) project. The primary goal of the CIRA project is to estimate the degree to which climate change impacts and damages to multiple U.S. sectors (e.g., human health, water resources) are avoided or reduced in the 21st century due to global reductions in greenhouse gases (GHGs). In this report, the benefits (or disbenefits) of global GHG mitigation are assessed as the difference between the physical impacts and economic damages in futures with and without mitigation policy, using multiple models driven by a consistent set of climatic, socioeconomic, and technological scenarios. In addition, the role of adaptation is modeled for some of the sectors to explore the potential for risk reduction and, where applicable, to quantify the costs associated with adaptive actions.
The methods and results of the CIRA project have been peer reviewed in the scientific literature, including a special issue of the journal Climatic Change entitled “A Multi-Model Framework to Achieve Consistent Evaluation of Climate Change Impacts in the United States.”1 The research papers underlying the modeling and results presented herein are cited throughout this website and are listed in Section B of the Technical Appendix.
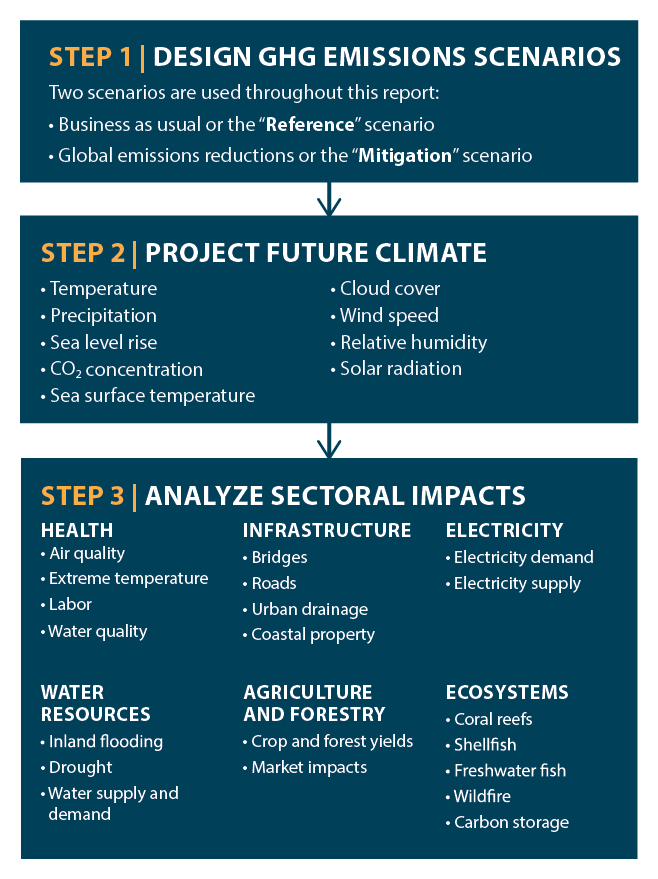
A three-step approach for assessing benefits includes developing GHG emissions scenarios; simulating future climate under these scenarios; and applying these projections in a series of coordinated impacts analyses encompassing six sectors (health, infrastructure, electricity, water resources, agriculture and forestry, and ecosystems). For more information on the objectives and design of the CIRA framework, please refer to Martinich et al. (2015).2
1. Design GHG Emissions Scenarios
GHG emissions from human activities, and the resulting climate change impacts and damages, depend on future socioeconomic development (e.g., population growth, economic development, energy sources, and technological change). Emissions scenarios provide scientifically credible starting points for examining questions about an uncertain future and help us visualize alternative futures.3 They are neither forecasts nor predictions, and the report does not assume that any scenario is more or less likely than another. GHG emissions scenarios are illustrations of how the release of different amounts of climate-altering gases and particles into the atmosphere will produce different climate conditions in the U.S. and around the globe.
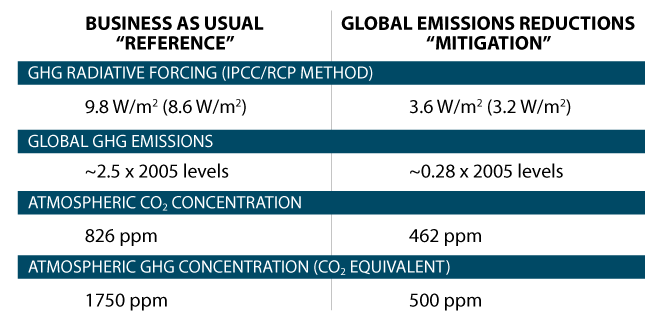
To allow for a better understanding of the potential benefits of global-scale GHG mitigation, the CIRA results presented in this report consider two emissions scenarios (see Table 1): a business-as-usual future in which GHG emissions continue to increase unchecked (referred to as the Reference scenario), and a mitigation scenario in which global GHG emissions are substantially reduced (referred to as the Mitigation scenario).4,5 These scenarios were developed using the Massachusetts Institute of Technology’s Emissions Predictions and Policy Analysis (EPPA) model,6 the human systems component within the Integrated Global System Model (IGSM). EPPA provides projections of world economic development and emissions, including analysis of proposed emissions control measures. These measures include, for example, limiting GHGs from major emitting sectors, such as electricity production and transportation. EPPA-IGSM, along with a linked climate model, provide a consistent framework to develop GHG emission and climate scenarios for impacts assessment.
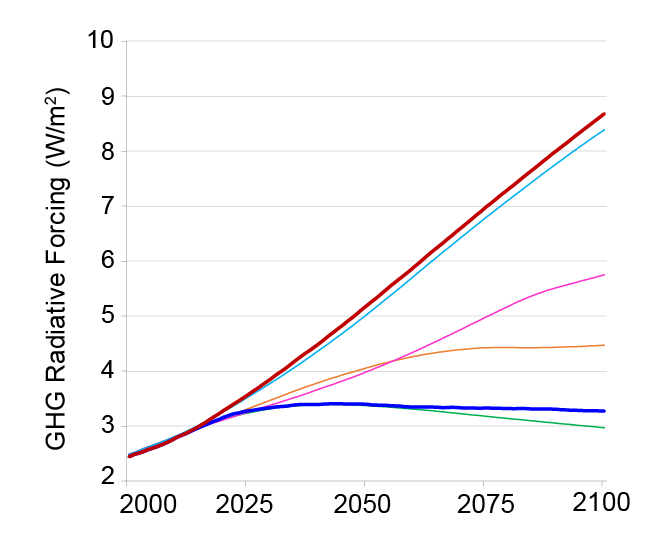
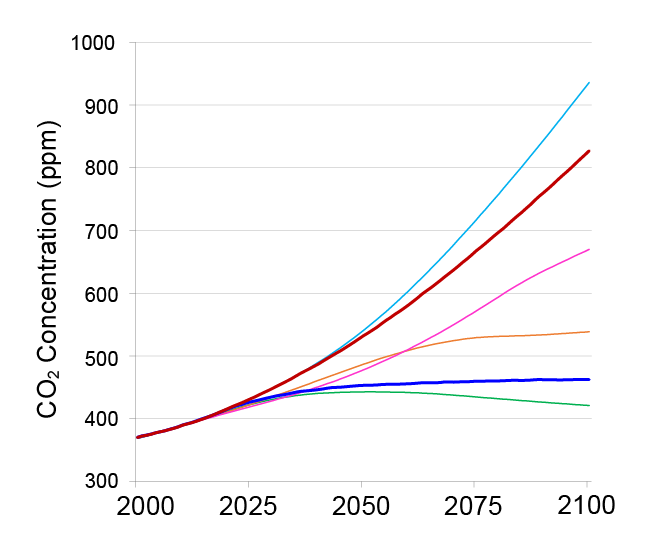
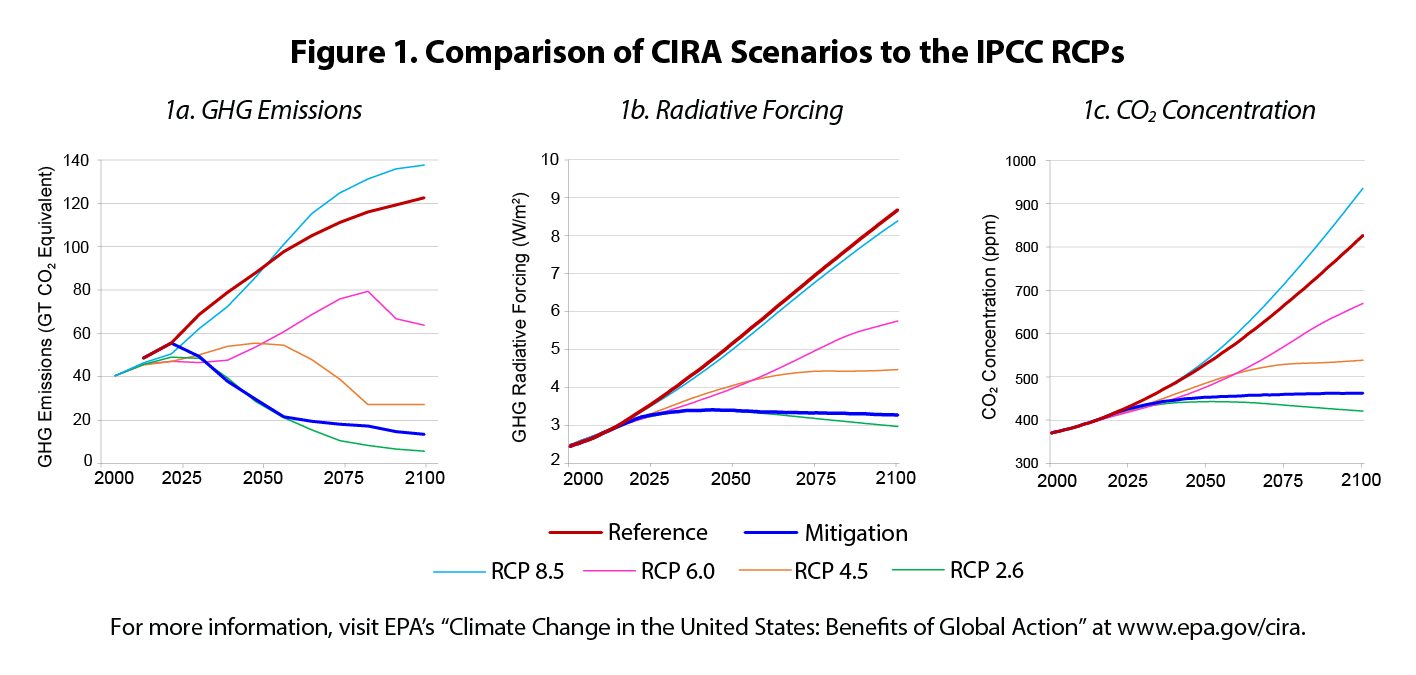
Table 1 provides information on the characteristics of each emissions scenario in 2100. Similar to the Representative Concentration Pathways (RCPs) used by the Intergovernmental Panel on Climate Change (IPCC) in its Fifth Assessment Report,7 the CIRA scenarios are based on different trajectories of GHG emissions and radiative forcing—a metric of the additional heat added to the Earth’s climate system caused by anthropogenic and natural emissions.
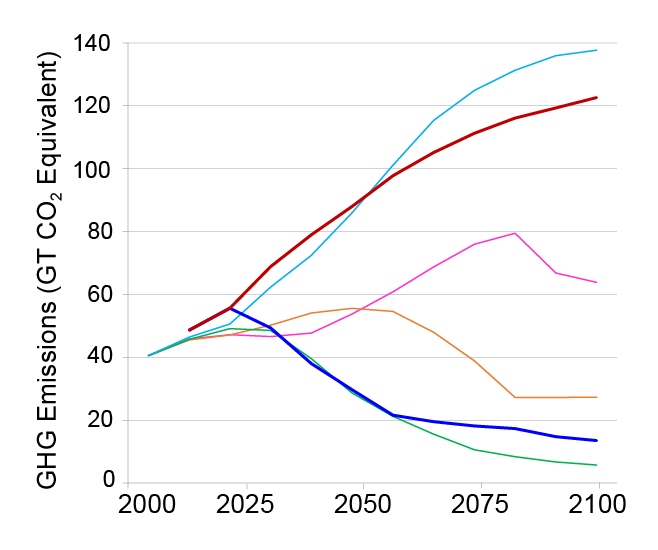
Figure 1 compares the two primary CIRA scenarios used throughout this report to the RCPs, showing that these scenarios fall within the range of IPCC's latest projections. The CIRA emissions scenarios provide illustrations for analytical comparison and do not represent specific policies. For more information about the design of these scenarios, please refer to Paltsev et al. (2013).8
Table 1. Characteristics of the Reference and Mitigation Scenarios in 2100
2. Project Future Climate
To simulate future climate in the U.S., CIRA primarily uses the IGSM-CAM framework, which links the IGSM to the National Center for Atmospheric Research’s Community Atmosphere Model (CAM). The IGSM-CAM simulates changes in a large number of climate variables, such as temperature and precipitation, at various temporal scales. Other outputs include: sea level rise, atmospheric CO2 concentration, cloud cover, wind speed, relative humidity, and solar radiation.11 The CIRA climate projections are briefly described in the following pages of this report. As described in the Levels of Certainty section, results using other climate models with different patterns of projected precipitation are compared to the IGSM-CAM results for sectoral analyses that are sensitive to changes in precipitation (e.g., drought and flooding). Specifically, results under the IGSM-CAM projections, which estimate a wetter future for most of the contiguous U.S., are complemented with drier projections to investigate the influence on impact estimates. Additional information on the development and characteristics of the CIRA climate projections can be found in Monier et al. (2014).12
3. Analyze Sectoral Impacts
This report analyzes 20 specific climate change impacts in the U.S., which are categorized into six broad sectors (health, infrastructure, electricity, water resources, agriculture and forestry, and ecosystems). The impacts were selected based on the following criteria: sufficient understanding of how climate change affects the sector; the existence of data to support the methodologies; availability of modeling applications that could be applied in the CIRA framework; and the economic, iconic, or cultural significance of impacts and damages in the sector to the U.S. It is anticipated that the coverage of sectoral impacts in the CIRA project will expand in future work.
To quantify climate change impacts in each sector, process-based or statistical models were applied using the socioeconomic and climate scenarios described above. This approach, which ensures that each model is driven by the same inputs, enables consistent comparison of impacts across sectors and in-depth analysis across regions and time. Many of the analyses explore the potential for adaptation to reduce risks and quantify the costs associated with adaptive actions (see the Sectors section of this report and Section D of the Technical Appendix for more information).13 Lastly, the CIRA analyses investigate key sources of variability in projecting future climate, as further described in the Levels of Certainty section.
Global Temperature Change
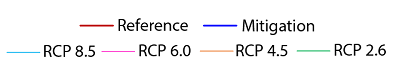
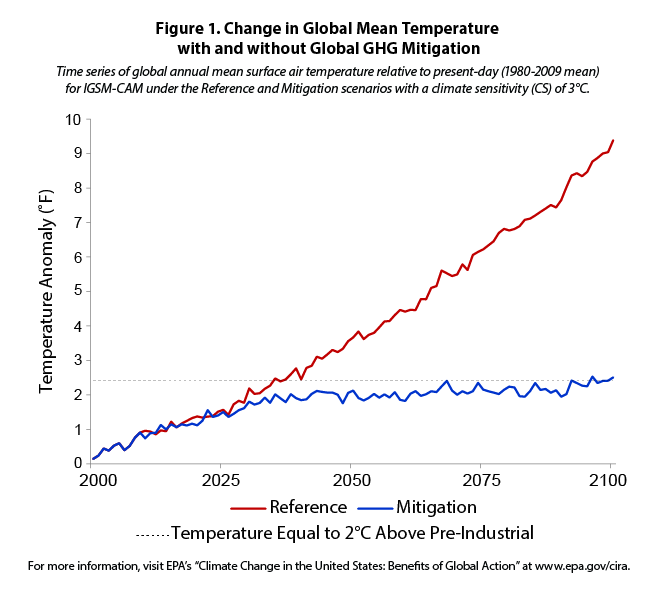
Global mean temperature under the CIRA Reference scenario is projected to increase by over 9°F by 2100 (Figure 1). This estimated increase is consistent with the USGCRP Third National Climate Assessment, which projects a range of 5-11°F by 2100.14,15 To help illustrate the magnitude of such a change in global mean temperature, the last ice age, which covered the northern contiguous U.S. with ice sheets, was approximately 9°F cooler than today. While some areas will experience greater increases than others, Figure 1 presents the average change that is projected to occur across the globe under the Reference and Mitigation scenarios. As shown, temperatures in the Mitigation scenario eventually stabilize, though due to the inertia of the climate system, stabilization is not reached until several decades after the peak in radiative forcing. The Reference scenario continues to warm, reaching a temperature increase of almost five times that of the Mitigation scenario by the end of the century. This demonstrates that significant GHG mitigation efforts can stabilize temperatures and avoid an additional 7°F of warming this century, but due to climate system inertia, benefits may not be apparent for several decades.
Figure 1. Change in Global Mean Temperature with and without Global GHG Mitigation
 Time series of global annual mean surface air temperature relative to present-day (1980-2009 mean) for IGSM-CAM under the Reference and Mitigation scenarios with a climate sensitivity (CS)16 of 3°C.
download the figure; download the data
Limiting Future Warming to 2°C
Limiting the future increase in global average surface temperature to below 2°C (3.6°F) above preindustrial levels is a commonly regarded goal for avoiding dangerous climate change impacts.17 Global temperatures, however, have already warmed 0.85°C (1.5°F) from preindustrial times.18,19 The level of global GHG mitigation achieved under the CIRA Mitigation scenario is consistent with the amount required to meet the 2°C target (Figure 1),20 and therefore the estimates presented in this report describing the potential benefits to the U.S. of global GHG mitigation are a reasonable approximation of the benefits that would result from meeting this goal.
Temperature Change in the U.S.
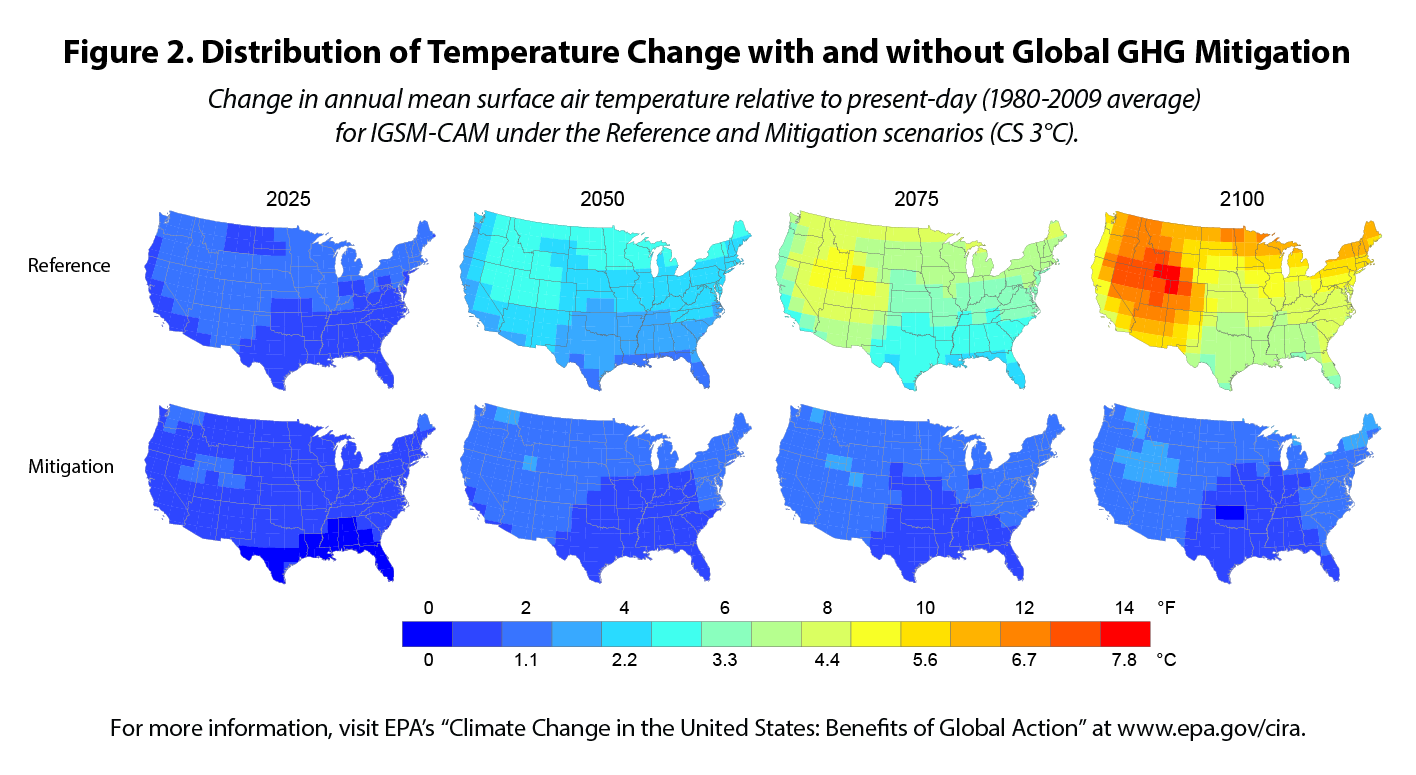
Under the Reference scenario, the largest increases in average temperature across the contiguous U.S. by 2100 are projected to occur in the Mountain West—up to a 14°F increase from present-day average temperature (Figure 2). The northern regions are also likely to see larger temperature increases than the global average (up to 12°F, compared to a global average of 9.3°F), while the Southeast is projected to experience a relatively lower level of overall warming (but comparable to the global average increase). Under the Mitigation scenario, temperature increases across the country are far lower compared to the Reference, with no regions experiencing increases of more than 4°F.
Figure 2. Distribution of Temperature Change with and without Global GHG Mitigation
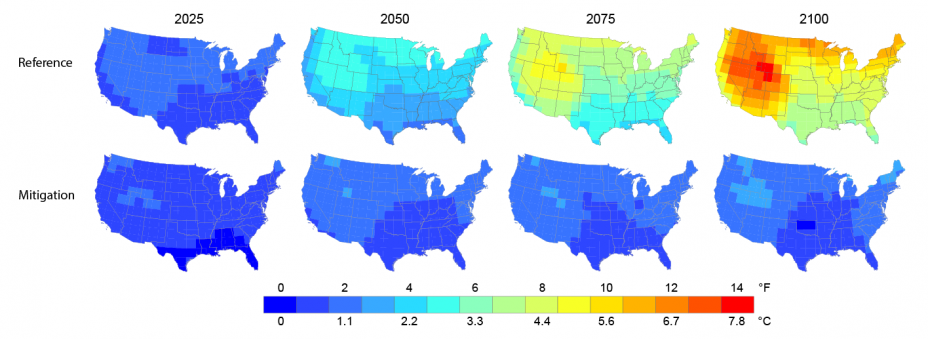 Change in annual mean surface air temperature relative to present-day (1980-2009 average) for IGSM-CAM under the Reference and Mitigation scenarios (CS 3°C).
download the figure; download the data
Seasonal and Extreme Temperatures
Just as presenting global average temperature changes masks geographic patterns of variability, presenting annual average temperature changes conceals seasonal patterns of change. Some seasons are expected to warm faster than others, and the impacts of warming will also vary by season. For example, in some regions, greater levels of warming may occur in the winter, but warming in summer will matter most for changes in the frequency and intensity of heat waves. Figure 3 provides an illustrative example of the changes in average summertime temperature that select states may experience over time with and without global GHG mitigation. Under the Reference scenario, summertime temperatures in some northern states are projected to feel more like the present-day summertime conditions in southern states. However, under the Mitigation scenario, states are projected to experience substantially smaller changes.
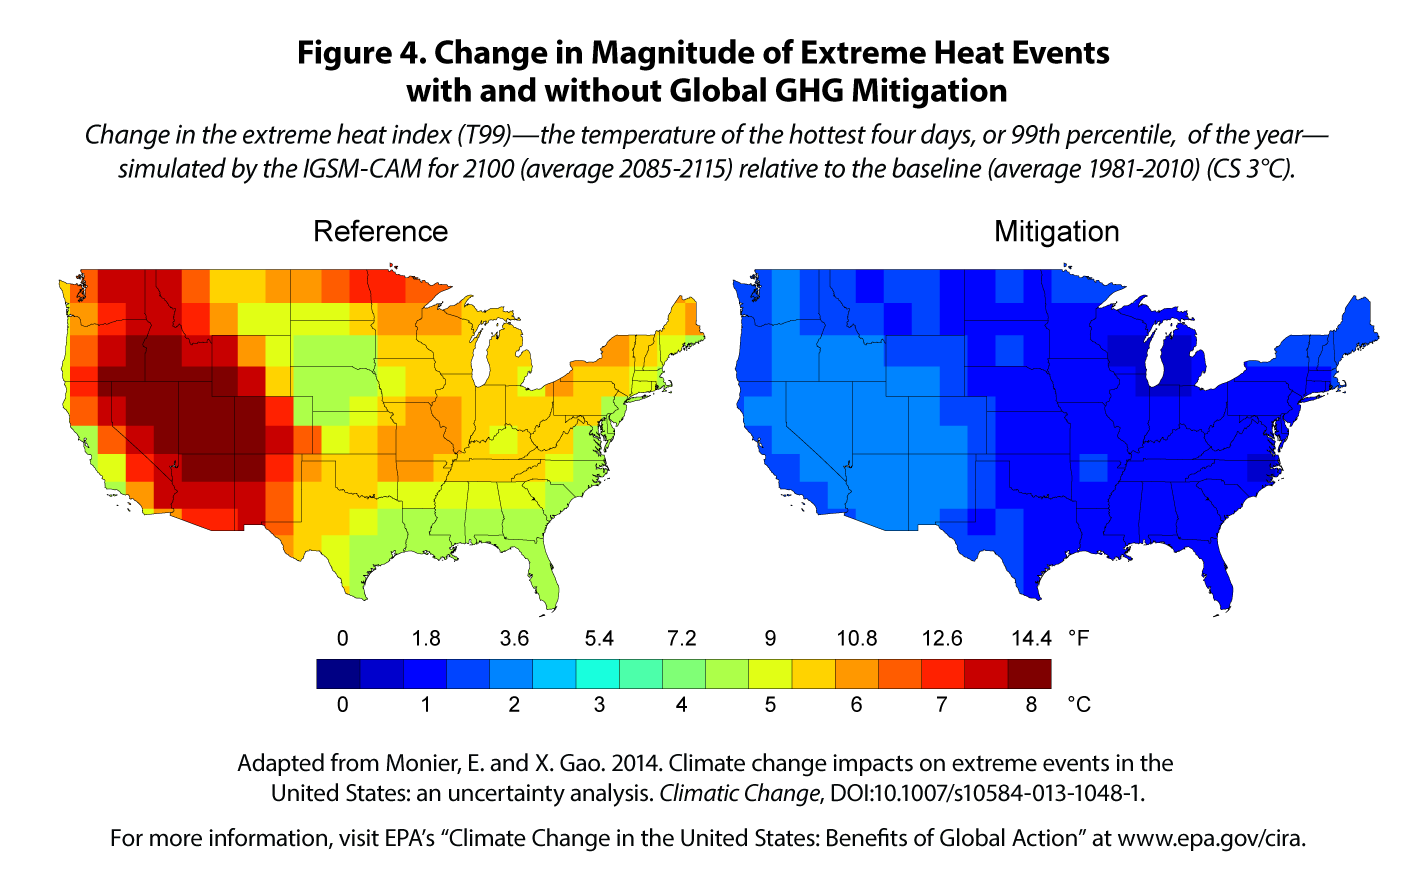
In addition to increasing average summertime temperatures, climate change is projected to result in an increase in extreme temperatures across most of the contiguous U.S. In the Mountain West, for example, the hottest days of the year are estimated to be over 14°F hotter than today under the Reference scenario by the end of the century (Figure 4). Many parts of the Midwest and Northeast are projected to experience increases in extreme temperatures ranging from 7-10°F, an amount similar to the increase in average summertime temperatures. These changes are projected to be far less severe under the Mitigation scenario, however, with no regions experiencing increases of more than 4°F.
Figure 3. Change in Summertime Temperatures for Select States with and without Global GHG Mitigation
The map compares mean summertime (June, July, and August) temperature in South Dakota, Illinois, and Maryland in 2050 and 2100 under the Reference and Mitigation scenarios to states with similar present-day temperatures. For example, the projected mean summertime temperature in Illinois in 2100 under the Reference scenario (83°F) is projected to be analogous to the mean summertime temperature in Louisiana from 1980-2009 (81°F). In other words, without global GHG mitigation, Illinois summers by 2100 are projected to “feel like” present-day Louisiana summers. The maps are not perfect representations of projected climate, as other factors such as humidity are not included, but they do provide a way of visualizing the magnitude of possible changes in the summertime conditions of the future.
Figure 4. Change in Magnitude of Extreme Heat Events with and without Global GHG Mitigation
 Change in the extreme heat index (T99)—the temperature of the hottest four days, or 99th percentile, of the year—simulated by the IGSM-CAM for 2100 (average 2085-2115) relative to the baseline (average 1981-2010) (CS 3°C).21
download the figure; download the data
Precipitation in the U.S.
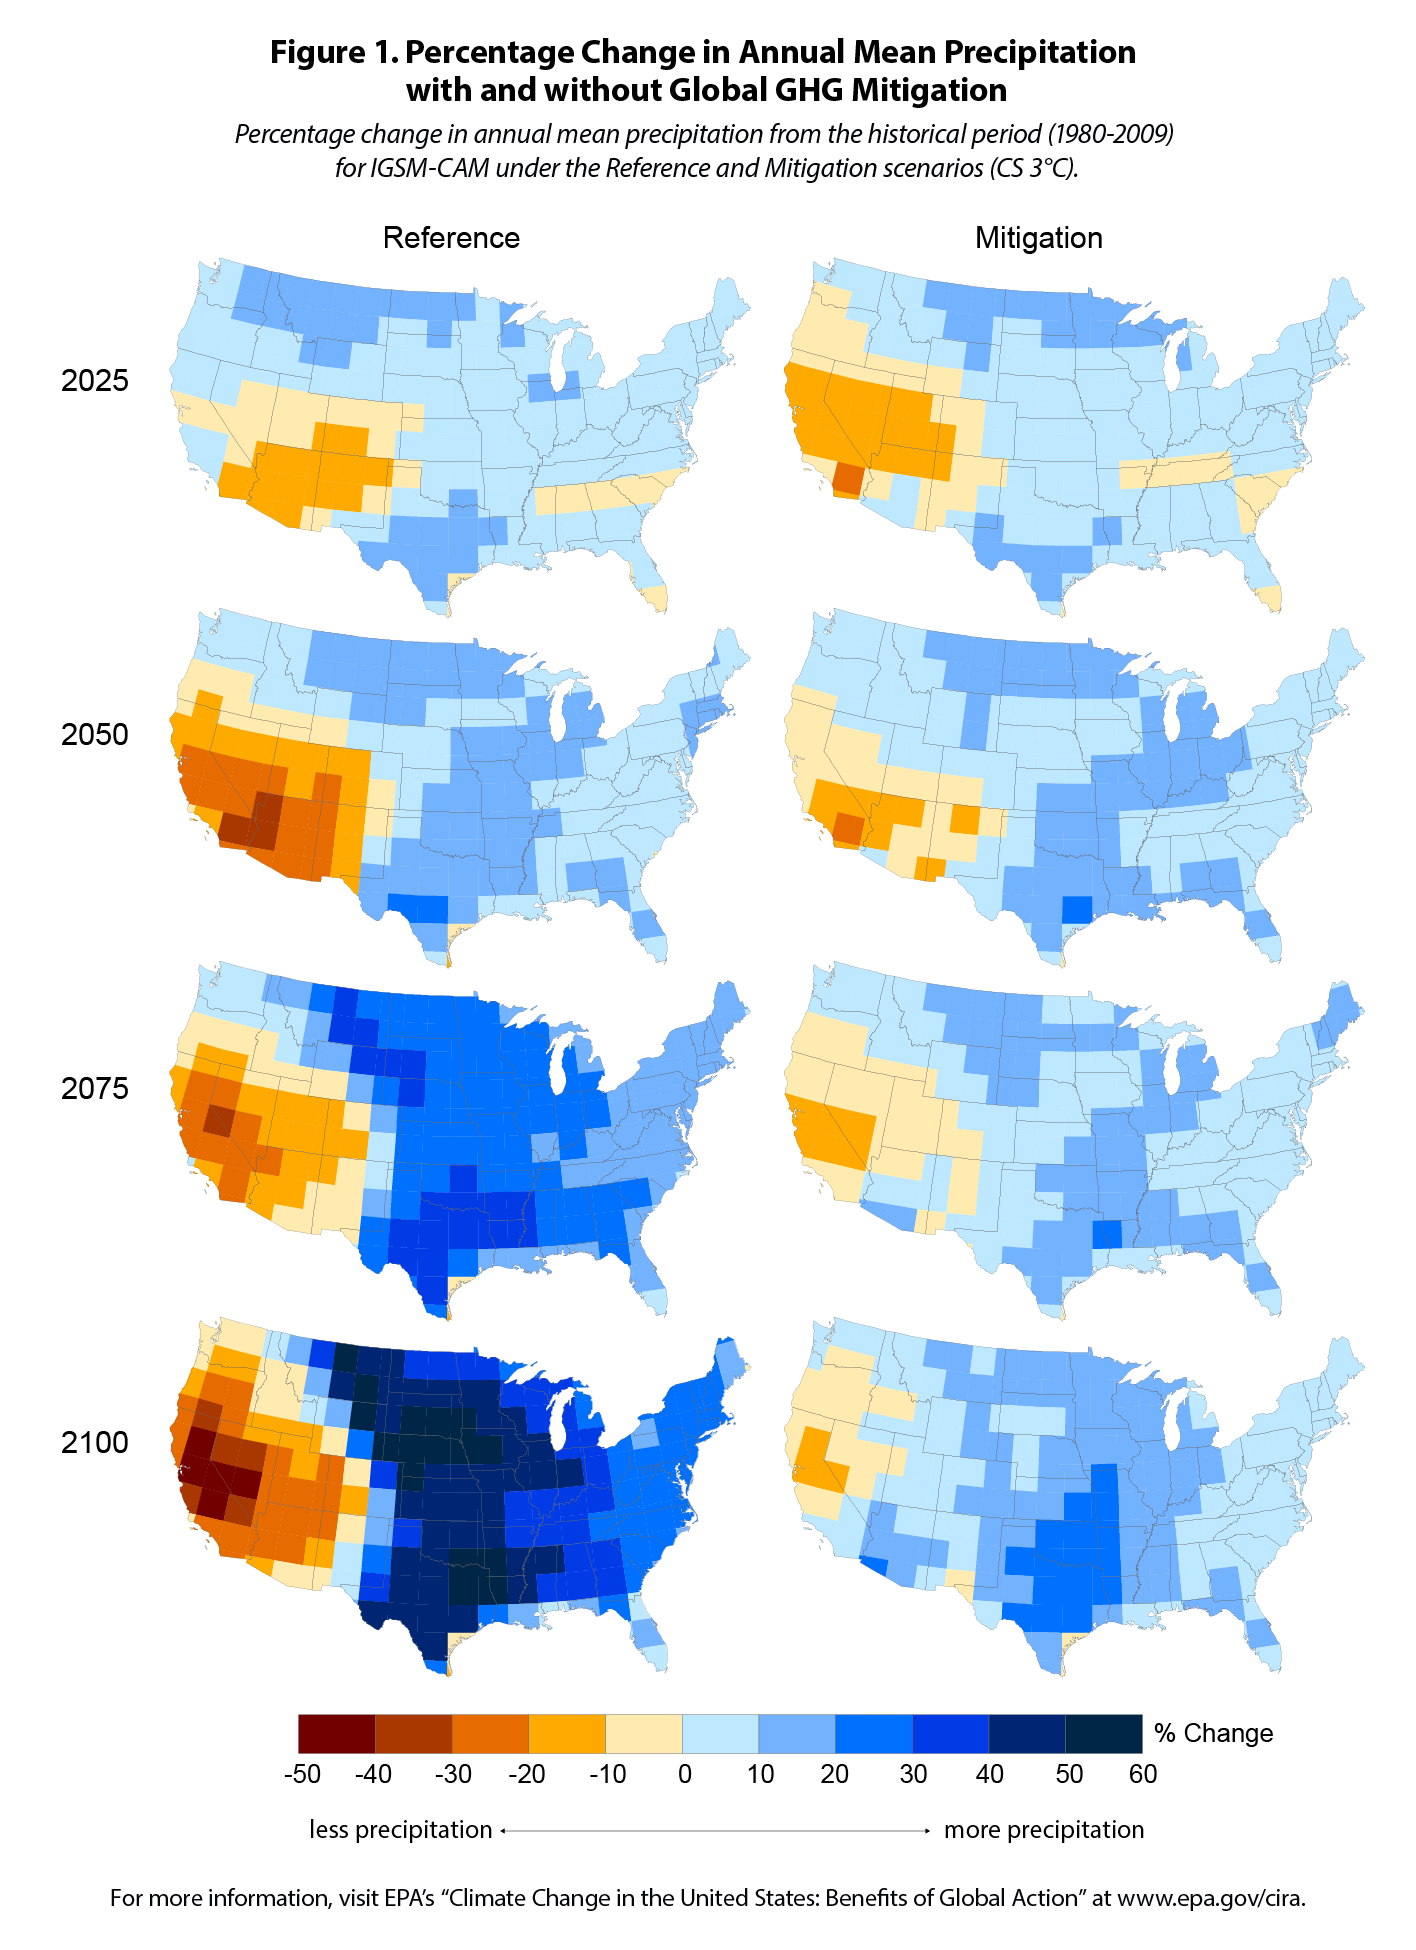
The IGSM-CAM projects future changes in annual mean precipitation over the course of the 21st century under the Reference and Mitigation scenarios (Figure 1). Under the CIRA Reference scenario, the model estimates increasing precipitation over much of the U.S., especially over the Great Plains. However, the western U.S. is estimated to experience a decrease in precipitation compared to present day.
Under the Mitigation scenario, a similar but less intense pattern of increasing precipitation is projected over much of the country, particularly in the central states.
As projections of future precipitation vary across individual climate models, the CIRA analyses use outputs from additional climate models (see the Levels of Certainty section of this report). Compared to multi-model ensemble projections presented in the IPCC and USGCRP, the CIRA projections exhibit some regional differences in the pattern of projected precipitation. A comparison between the CIRA climate projections and those presented in these assessment reports can be found in Section E of the Technical Appendix.
Figure 1. Percentage Change in Annual Mean Precipitation with and without Global GHG Mitigation
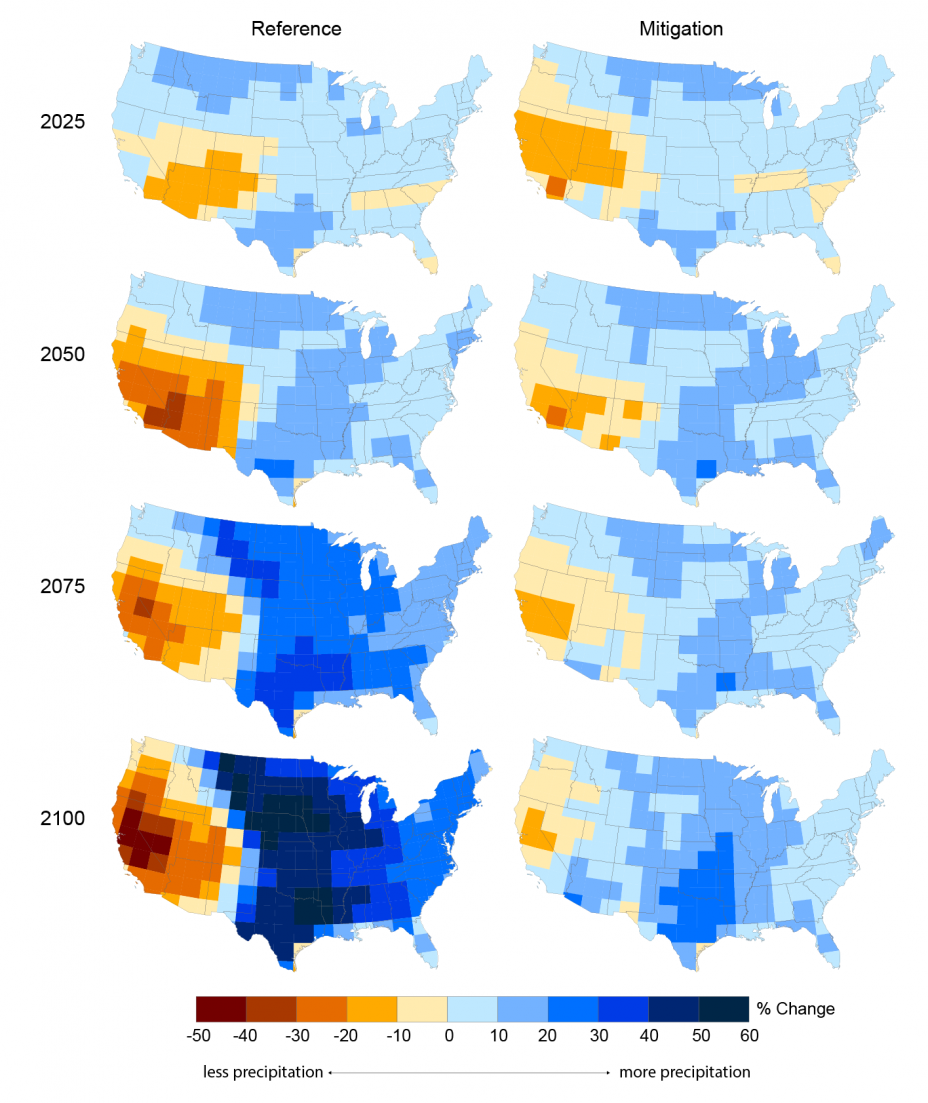 Percentage change in annual mean precipitation from the historical period (1980-2009) for IGSM-CAM under the Reference and Mitigation scenarios (CS 3°C).
download the figure; download the data
Extreme Precipitation
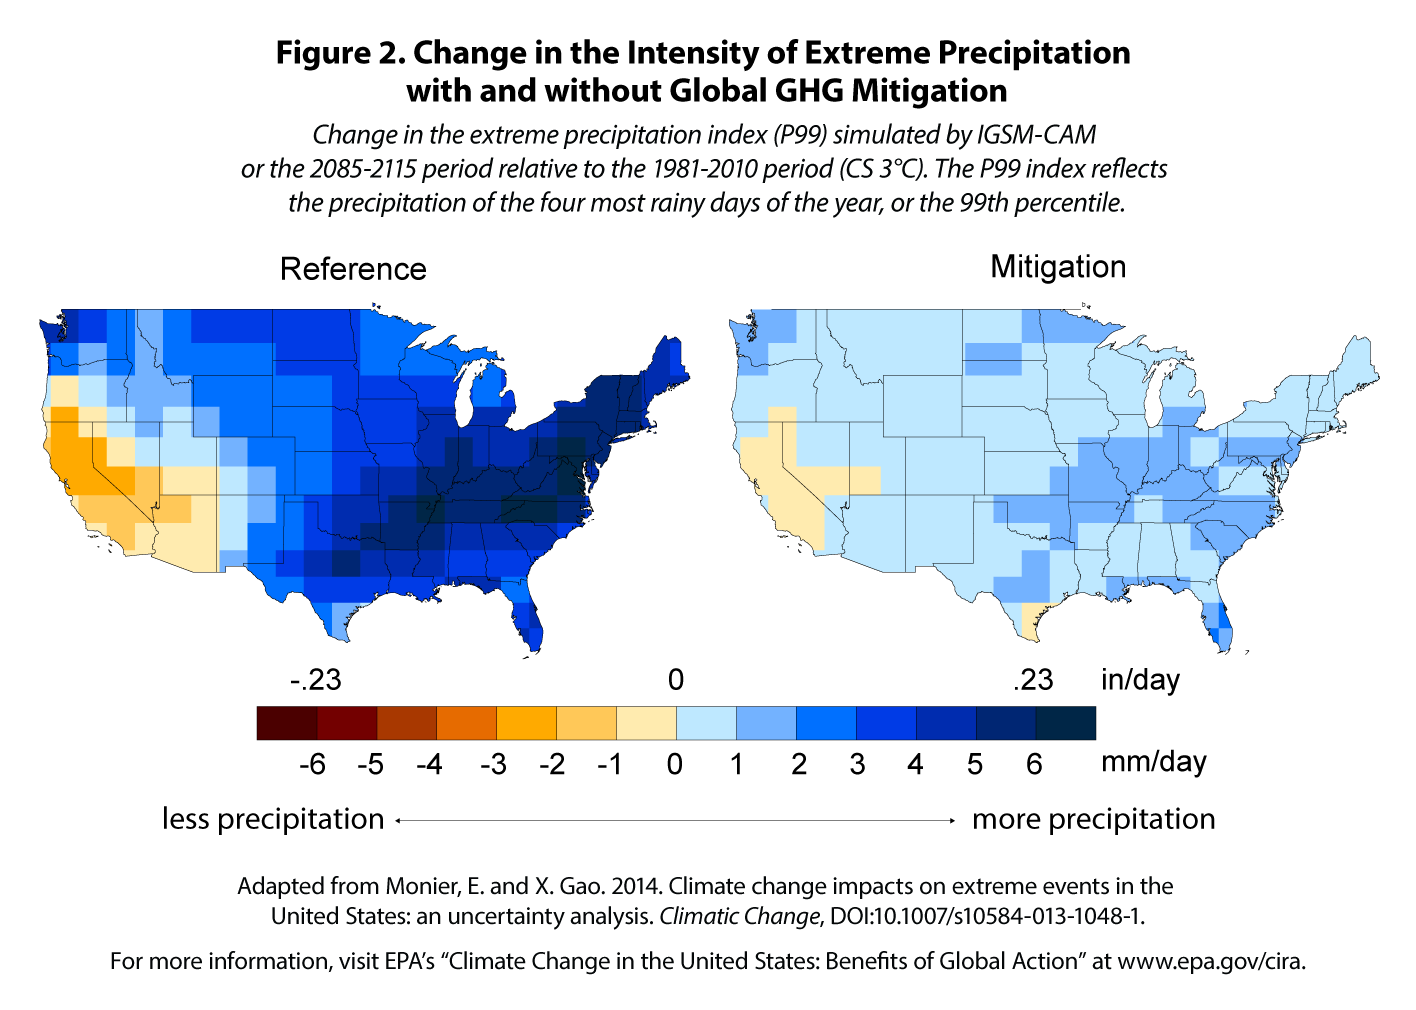
Figure 2 shows the change in the intensity of extreme precipitation events from present day to 2100. Blue areas on this map indicate that the future’s heaviest precipitation events will be more intense compared to today. Under the Reference, the IGSM-CAM shows a general increase in the intensity of extreme precipitation events, except over California. The increase is particularly strong over the Northeast, Midwest, and Southeast. Global GHG mitigation is likely to greatly reduce the increase in intensity of extreme precipitation events, as shown in the right panel of Figure 2.
Figure 2. Change in the Intensity of Extreme Precipitation with and without Global GHG Mitigation
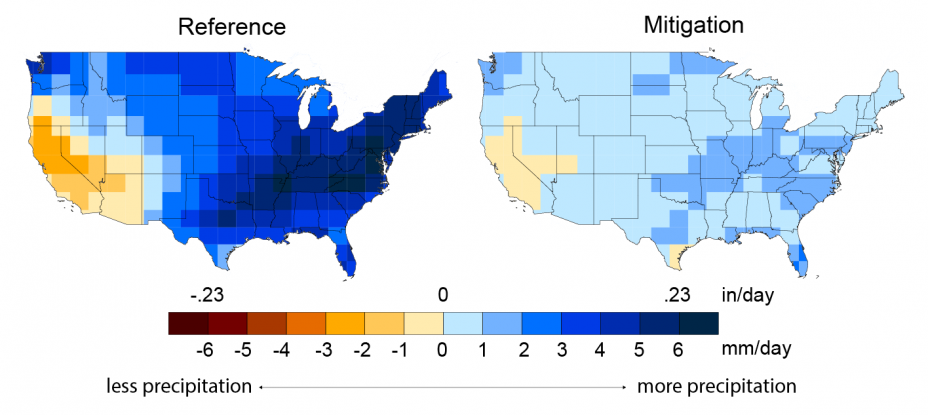 Change in the extreme precipitation index (P99) simulated by IGSM-CAM for the 2085-2115 period relative to the 1981-2010 period (CS 3°C). The P99 index reflects the precipitation of the four most rainy days of the year, or the 99th percentile.22
download the figure; download the data
Global Sea Level Rise
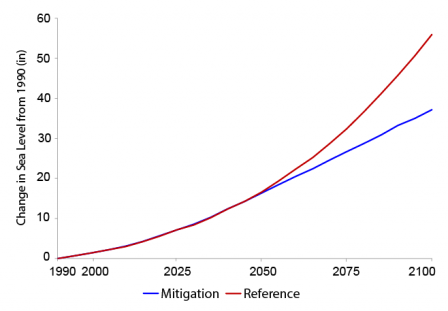
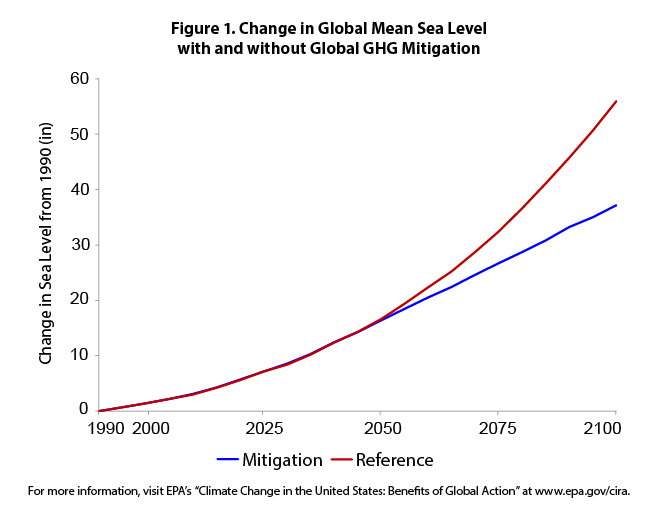
Figure 1 shows the change in global mean sea level from present day to 2100 under the Reference and Mitigation scenarios. Global mean sea levels are projected to rise about 56 inches by 2100 under the Reference and about 37 inches under the Mitigation scenario. These results fall within the range for risk planning presented in the Third National Climate Assessment of 8-79 inches by 2100, with the Reference scenario's rate being slightly larger than the Assessment's likely range of 12-48 inches.23,24 As shown in Figure 1, global sea level rise is similar across the CIRA scenarios through mid-century, primarily due to inertia in the global climate system and lasting effects from past GHG emissions. As a result, it is not until the second half of the century that global GHG mitigation results in a reduction in sea level rise compared to the Reference.
The projections for global sea level rise account for dynamic ice-sheet melting by estimating the rapid response of sea levels to atmospheric temperature change.25 These adjustments incorporate estimates of ice-sheet melt from the empirical model of Vermeer and Rahmstorf (2009),26,27 using the decadal trajectory of global mean surface air temperature results from the IGSM as inputs.28
Figure 1. Change in Global Mean Sea Level with and without Global GHG Mitigation
Sea Level Rise in the U.S.
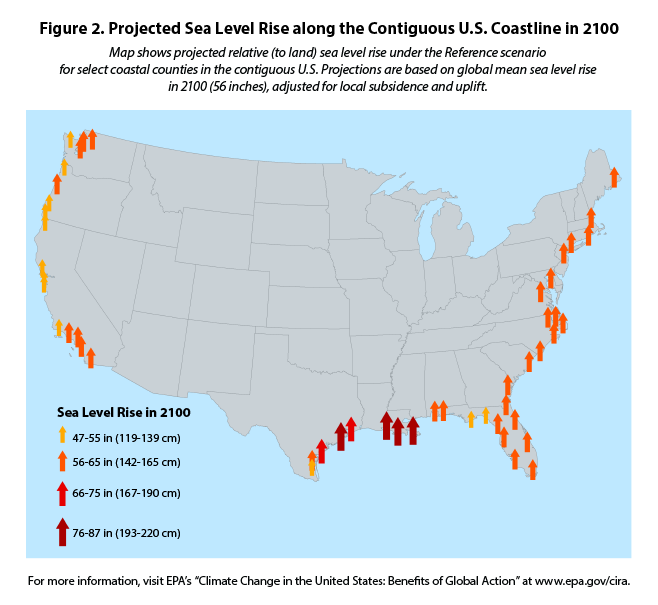
Figure 2 shows projected relative sea level rise under the Reference scenario for select areas along the U.S. coast in 2100. For each coastal area, global rates of sea level change under the two scenarios were adjusted to account for vertical land movement (e.g., subsidence or uplift) using tide gauge data.29 Areas located along the Gulf of Mexico and Atlantic Coast are projected to experience greater sea level rise, due to compounding effects of land subsidence, while areas along the West Coast are estimated to experience relatively lower levels of rise.
Figure 2. Projected Sea Level Rise along the Contiguous U.S. Coastline in 2100
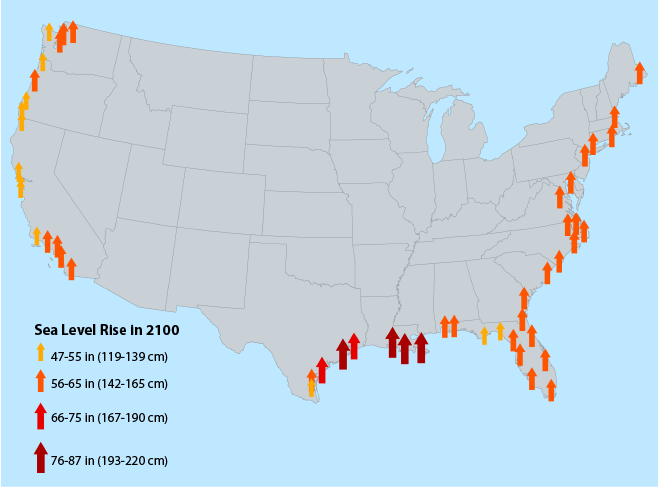 Map shows projected relative (to land) sea level rise under the Reference scenario for select coastal counties in the contiguous U.S. Projections are based on global mean sea level rise in 2100 (56 inches), adjusted for local subsidence and uplift.30
download the figure; download the data
The CIRA modeling project was designed to investigate the relative importance of four key sources of uncertainty inherent to projecting future climate:
- Future GHG emissions: Future emissions will be driven by population growth, economic growth, technology advancements, and decisions regarding climate and energy policy. Sensitivity analyses explore the uncertainty associated with varying levels of future GHG emissions under different policy scenarios.
- Climate sensitivity: Future climate change depends on the response of the global climate system to rising GHG concentrations (i.e., how much temperatures will rise in response to a given increase in atmospheric CO2). This response is complicated by a series of feedbacks within Earth’s climate system that act to amplify or diminish an initial change.31 Climate sensitivity is typically reported as the change in global mean temperature resulting from a doubling in atmospheric CO2 concentration.
- Natural variability: Natural, small- to medium-scale variations within Earth’s climate system, such as El Niño events and other recurring patterns of ocean-atmosphere interactions, can drive increases or decreases in global or regional temperatures, as well as affect precipitation and drought patterns around the world. These types of natural variability cause uncertainty in temperature and precipitation patterns over timescales ranging from months up to a decade or more, but have a smaller effect on Earth’s climate system over longer periods of time.32
- Climate model: Different types of global-scale physical and statistical models are used to study aspects of past climate and develop projections of future change. The climate is very complex and is influenced by many uncertain factors; as a result, each model is different and produces different results. These complex models provide useful information both individually, by allowing the exploration of potential futures, and collectively, by providing insight on the level of agreement across models.
The CIRA uncertainty framework, described in detail in Monier et al. (2014),33 explores these four major sources of uncertainty, including the influence that each could have on future temperature or precipitation in the U.S. While the effects of each source of uncertainty are not described for each sectoral impact discussed in this report, some of the impacts described in the Sectors section explore the potential influence of these factors. Maps presented in this section are adapted from Monier et al. (2014).34
Emissions Scenarios
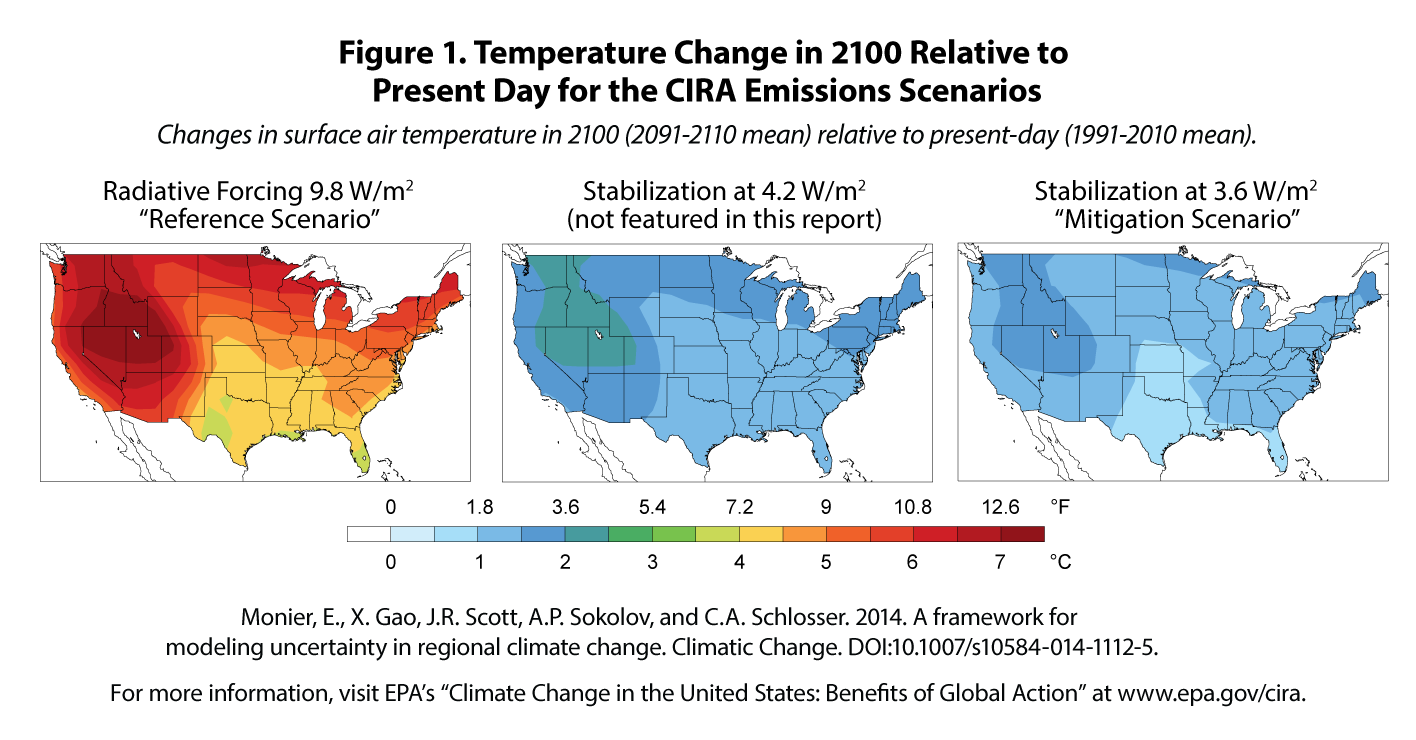
The CIRA framework includes scenarios with different levels of GHG emissions: a business-as-usual scenario with unconstrained emissions (“Reference”) and a total radiative forcing of 9.8 W/m2 by 2100 (8.6 W/m2 using the IPCC method for calculating radiative forcing); a stabilization scenario reflecting global-scale reductions in GHG emissions, with a total radiative forcing of 4.2 W/m2 by 2100 (3.8 W/m2 using IPCC method; this scenario is not featured in this report); and a more stringent stabilization scenario with greater emissions reductions (”Mitigation”) and a total radiative forcing of 3.6 W/m2 by 2100 (3.2 W/m2 using IPCC method).35 Results using the Reference and Mitigation scenarios are the focus of this report.
Figure 1. Temperature Change in 2100 Relative to Present Day for the CIRA Emissions Scenarios
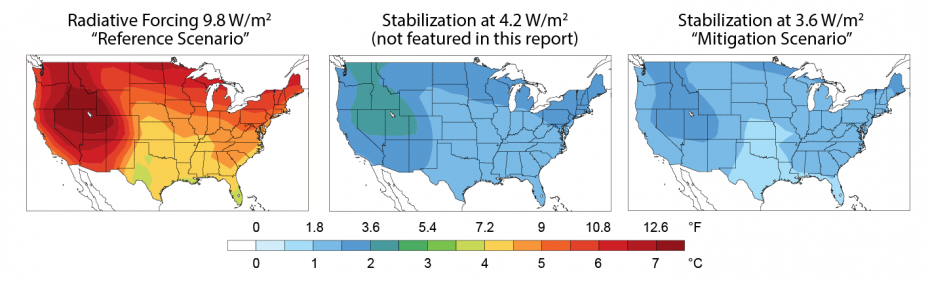 Changes in surface air temperature in 2100 (2091-2110 mean) relative to present-day (1991-2010 mean).36
download the figure; download the data
Climate Sensitivity
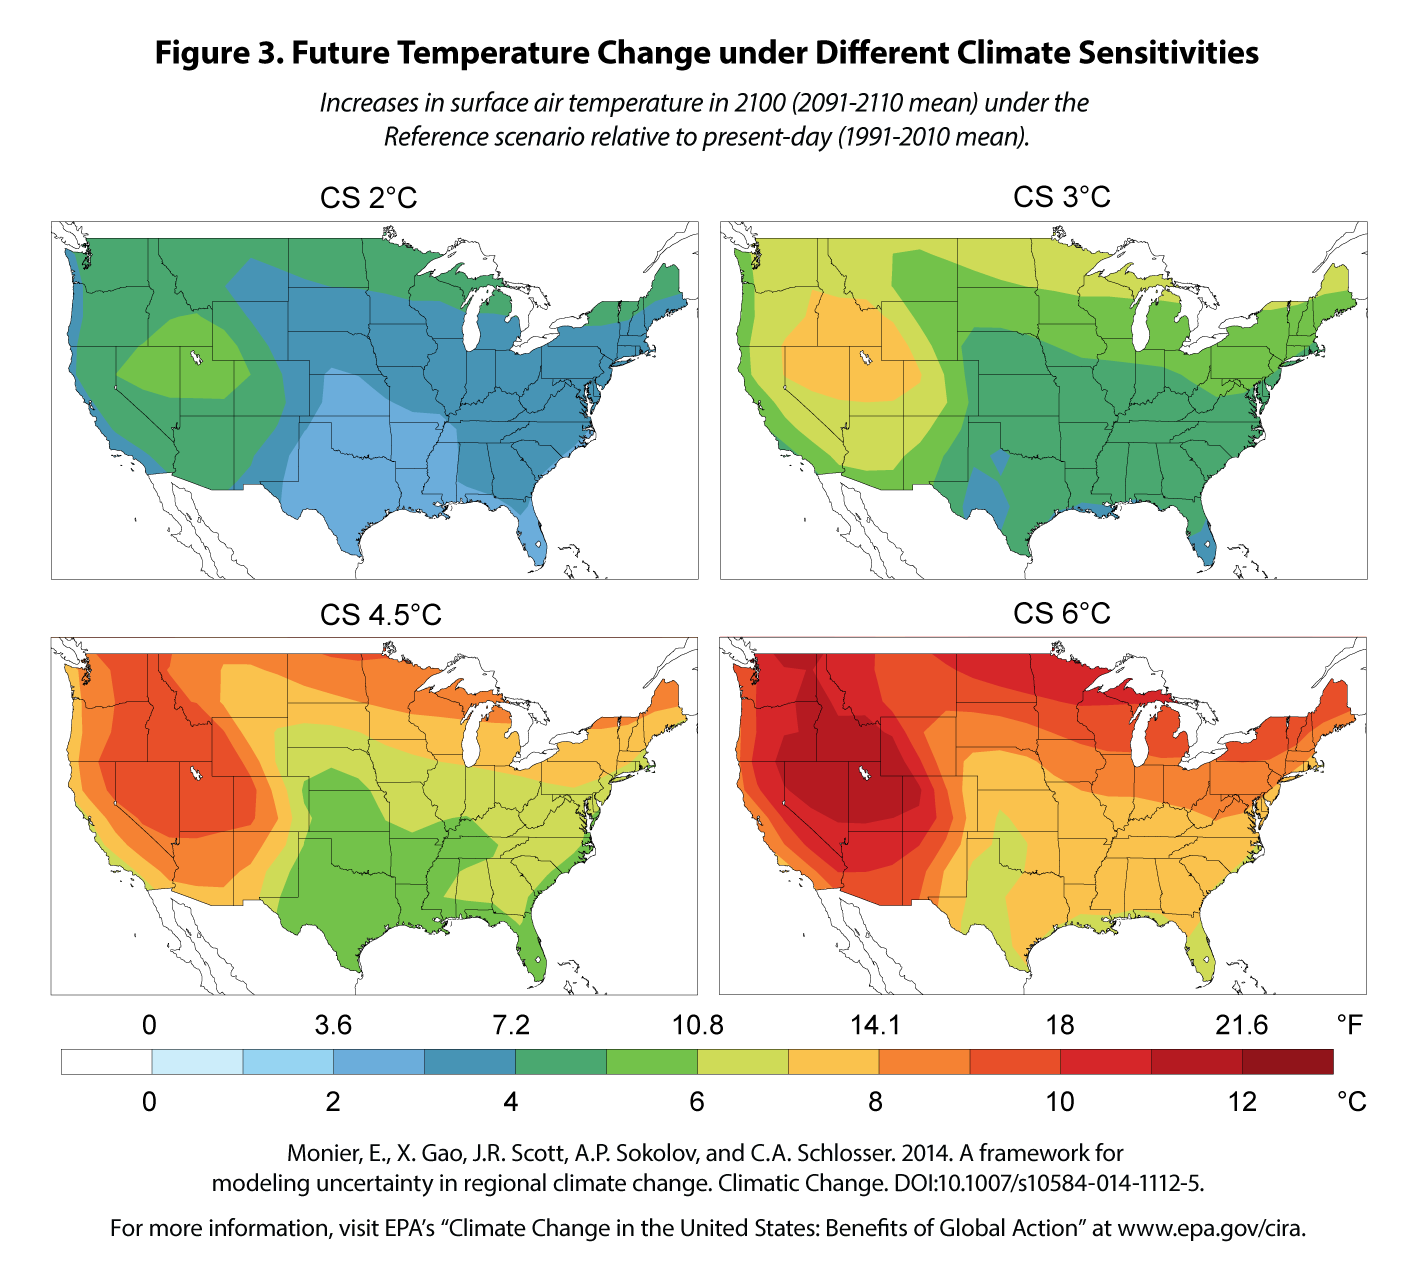
The four climate sensitivity values considered are 2, 3, 4.5, and 6°C, which represent, respectively, the lower bound (CS 2°C), best estimate (CS 3°C), and upper bound (CS 4.5°C) of likely climate sensitivity based on the IPCC Fourth Assessment Report (AR4),37 and a low-probability/high-risk climate sensitivity (CS 6°C).38 Results using a climate sensitivity of 3°C are the focus of this report.
Figure 2. Influence of Climate Sensitivity on Global Temperature Change Relative to Present Day
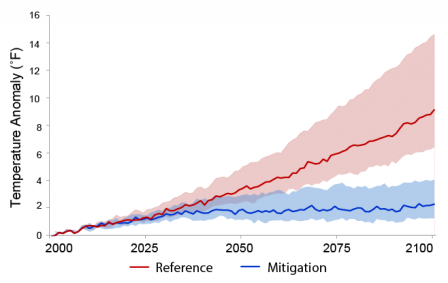 Temperature change relative to the historic baseline (mean 1980-2009) under the Reference and Mitigation scenarios. The bold lines represent the results using a climate sensitivity of 3°C, and the shaded areas represent the range of temperature anomaly outcomes when using climate sensitivities of 2°C and 6°C.
download the figure; download the data
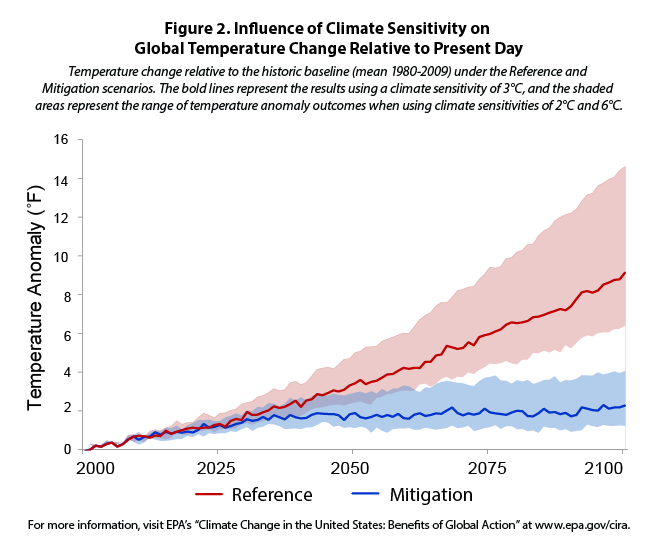
Figure 3. Future Temperature Change under Different Climate Sensitivities
 Increases in surface air temperature in 2100 (2091-2110 mean) under the Reference scenario relative to present-day (1991-2010 mean).39
download the figure; download the data
Natural Variability
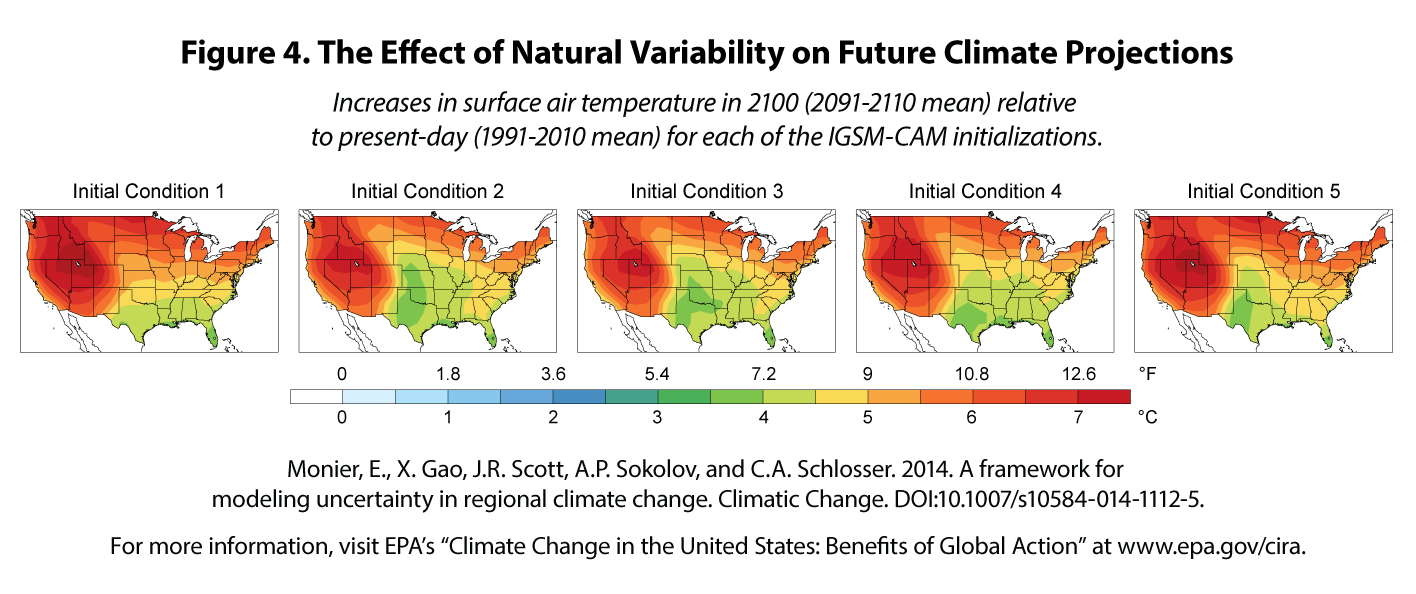
For each emissions scenario and climate sensitivity combination, the IGSM-CAM was simulated five times with slightly different initial conditions (“initializations”) to account for uncertainty due to natural variability. Some sectors in the report use the average result of the five initializations.
Figure 4. The Effect of Natural Variability on Future Climate Projections
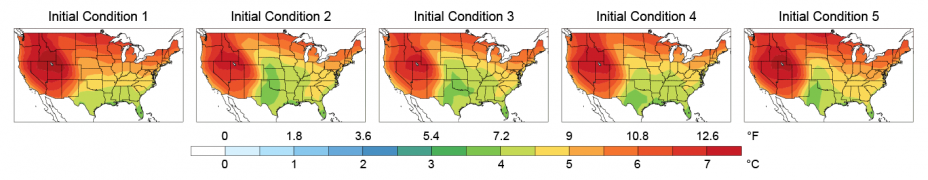 Increases in surface air temperature in 2100 (2091-2110 mean) relative to present-day (1991-2010 mean) for each of the IGSM-CAM initializations.40
download the figure; download the data
Climate Model
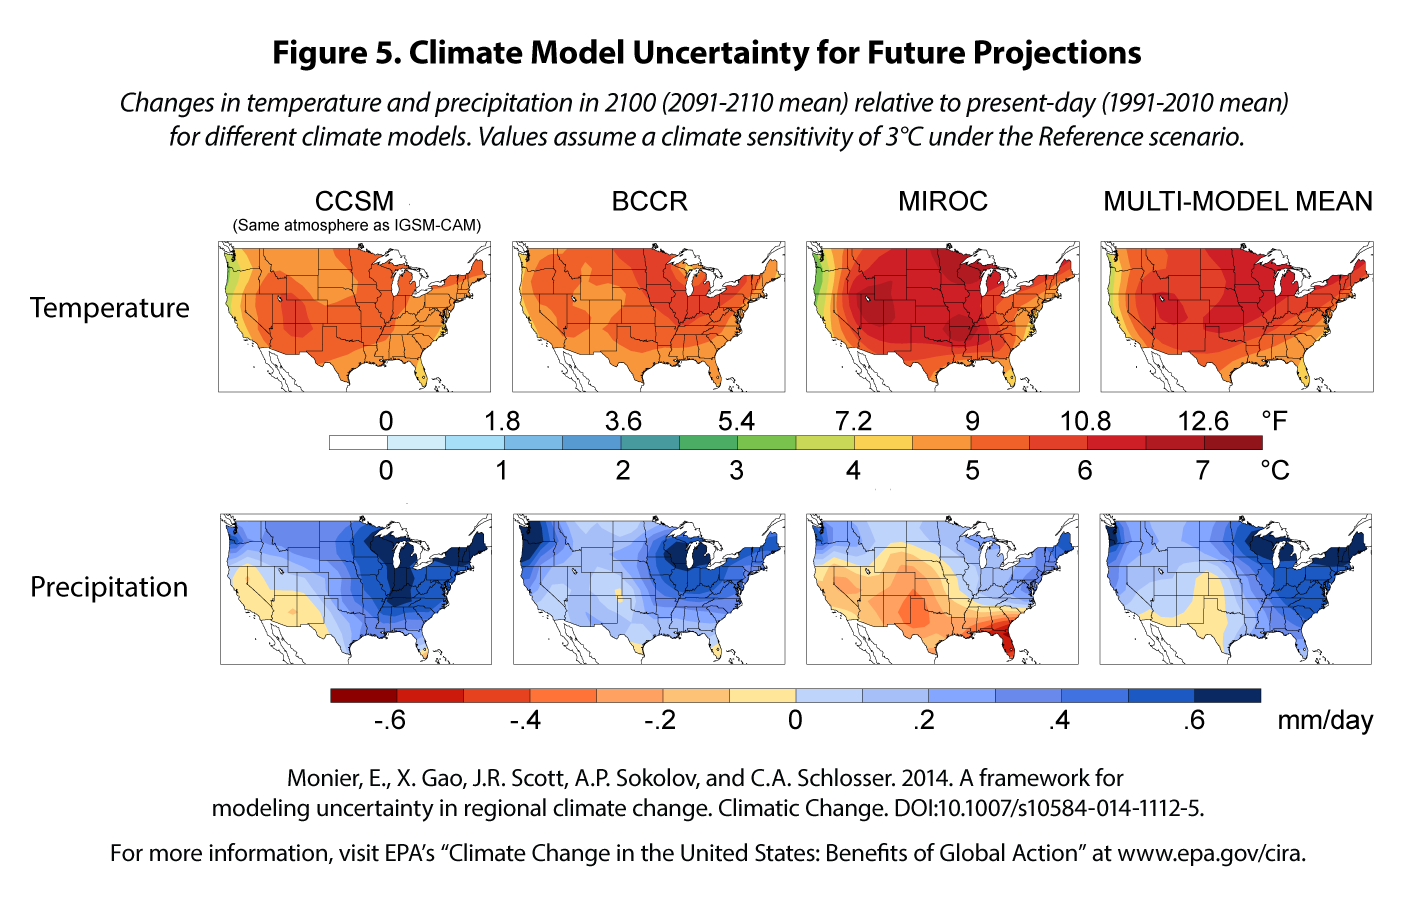
The results presented in this report rely primarily upon climate projections from the IGSM-CAM. To analyze the implications of a broader set of climate model outputs, the CIRA framework uses a pattern scaling method in the IGSM41 for three additional climate models, plus a multi-model ensemble mean from the IPCC AR4 archive. As shown in Figure 5, there is better agreement across climate models with regards to temperature projections, and higher variability with regards to precipitation projections.42
- The NCAR Community Climate System Model version 3 (CCSM3.0) was chosen to compare with the IGSM- CAM model. Both have the same atmospheric and land components and similar biases over land.
- Bjerknes Centre for Climate Research Bergen Climate Model version 2.0 (BBCR_BCM2.0) was chosen because this model projects the largest increases in precipitation over the contiguous U.S.
- Model for Interdisciplinary Research on Climate version 3.2 medium resolution (MIROC3.2_medres) was chosen because this model projects decreases in precipitation over much of the contiguous U.S. Results using this “drier” pattern are shown in several sections of this report to provide comparison to the “wetter” IGSM-CAM simulations, which generally show increases in precipitation for much of the country (excluding the West). This comparison helps to bound uncertainty in future changes in precipitation for the contiguous U.S.
Figure 5. Climate Model Uncertainty for Future Projections
 Changes in temperature and precipitation in 2100 (2091-2110 mean) relative to present-day (1991-2010 mean) for different climate models. Values assume a climate sensitivity of 3°C under the Reference scenario.
download the figure; download the data
Future Climate Change Across Uncertainty Sources
Investigation of the relative contribution of the four sources of uncertainty described in this section reveals that temperature change is most influenced by decisions regarding whether to reduce GHG emissions and the value of climate sensitivity used (GHG emissions scenario being the dominant contributor). The contributions from different climate models and natural variability for temperature change are small in comparison. It is worth noting that the GHG emissions scenario is the only source of uncertainty that society has control over. Conversely, these same four sources of uncertainty contribute in roughly equal measure to projected changes in precipitation over the U.S., with large spatial differences.43
The design of the CIRA project allows the results to be interpreted as the potential benefits (avoided impacts) to many economically important sectors of the U.S. due to global-scale actions to mitigate GHG emissions. The analytical approach offers a number of advantages, including consistency in the use of socioeconomic and climate change scenarios across a wide range of sectoral impact and damage models, and exploration of the changes in impacts and damages across key sources of uncertainty.
As with any study, there are some analytical boundaries of the CIRA project and its underlying analyses that are important to consider, several of which are described below.44 Future work to address these limitations will strengthen the estimates presented in this report, including the broader use of ranges and confidence intervals. Limitations specific to the individual sectoral analyses are described in the Sectors section of this report, as well as in the scientific literature underlying the analyses.
Emission and Climate Scenarios
With the goal of presenting a consistent and straightforward set of climate change impact analyses across sectors, this report primarily presents results for the Reference and Mitigation scenarios under a single simulation (initialization) of the IGSM-CAM climate model and assumes a climate sensitivity of 3°C. As described in the Levels of Certainty section, a large number of emissions and climate scenarios were developed under the CIRA project, reflecting various combinations of emissions scenarios, climate models, climate sensitivity, and climate model initializations. However, only some of these emissions and climate scenarios have been simulated across all sectoral analyses, primarily due to the level of effort necessary to run each scenario through the large number of sectoral models of the CIRA project. Analyzing results under the full set of scenarios would further characterize the range and potential likelihood of future risks.
Coverage of Sectors and Impacts
The analyses presented in this report cover a broad range of potential climate change impacts in the U.S., but there are many important impacts that have not yet been modeled in CIRA. Examples of these impacts include changes in vector-borne disease, morbidity from poor air quality, impacts on specialty crops and livestock, and a large number of effects on ecosystems and species. Without information on these impacts, this report provides only partial insight into the potential risks of climate change, and therefore does not account for all potential benefits of mitigation.
In addition, it is important to note that impacts are only partially valued economically in some sectors. For example, the Wildfire section presents estimated response and fuel management costs, but not other damages (e.g., health effects from decreased air quality, and property damages). A more complete valuation approach would likely increase the damages described in this report.
Finally, this report does not present results on the possibility of large-scale, abrupt changes that have wide-ranging and possibly catastrophic consequences, such as the intensification of tropical storms, or the rapid melting of the Greenland or West Antarctic ice sheets.45 In general, there are many uncertainties regarding the timing, likelihood, and magnitude of the impacts resulting from these abrupt changes, and data limitations have precluded their inclusion in the analyses presented in this report. Their inclusion would assist in better understanding the totality of risks posed by climate change and the potential for GHG mitigation to reduce or avoid these changes.
Variability Across Climate Models
The choice of climate model in an impact analysis can influence patterns of future climate change. Within a number of the CIRA analyses, this uncertainty was evaluated through the use of “pattern scaling,” a method by which the average change produced by running a climate model is combined with the specific geographic pattern of change calculated from a different model in order to approximate the result that would be produced by the second model. In this report, analyses that are sensitive to changes in precipitation are presented using both the IGSM-CAM (relatively wetter for the contiguous U.S.) and MIROC (relatively drier) climate models. However, not all sectoral impact models used pattern scaling in addition to the IGSM-CAM simulations, particularly for those impacts primarily driven by temperature, where there is generally more agreement across climate models. Finally, we note the limitation that pattern scaling is not a perfect representation of alternate models.46
Sectoral Impacts Modeling

With the exception of the electricity demand and supply sections of this report, the impact estimates presented were developed using a single sectoral impact model. While these models are complex analytical tools, the structure of the model, and how it may compare to the design of similar applications, can create important uncertainties that affect the estimation of impacts.47 The use of additional models for each sector would help improve the understanding of potential impacts in the future. The results presented in this report were developed with little or no interactions among the impact sectors. As a result, the estimated impacts may omit important and potentially unforeseen effects. For example, the wildfire projections presented in this report will likely generate meaningful increases in air pollution, a potentially important linkage for the air quality analysis. Similarly, there are numerous connections among the agriculture, water, and electricity sectors that affect the impacts estimates in each.48 Although some of these interactions are captured within integrated assessment models, it is difficult for these broader frameworks to capture all of the detail provided in the CIRA sectoral analyses. Improved connectivity between CIRA sectoral models will aid in gaining a more complete understanding of climate change impacts across sectors in the U.S.
Variability in Societal Characteristics
The impacts of climate change will not affect Americans equally. In addition to regional differences in impacts, socioeconomic factors (e.g., income, education) affect adaptive capacity and can make some communities more vulnerable to impacts. These issues are explored in the Coastal Property section, but the rest of the sectors do not analyze impacts across different levels of social vulnerability.
Feedbacks
The CIRA project uses a linear path from changes in socioeconomics and the climate system to impacts (with consistent inputs across multiple models). The socioeconomic scenarios that drive the CIRA modeling analyses do not incorporate potential feedbacks from climate change impacts to the climate system (e.g., GHG emissions from forest fires) and from sectoral damages to the economy (e.g., significant expenditures on “climate defensive” adaptation would likely reduce available financial capital to the economy for productive uses, or increase the cost of financing capital expenditures).
Geographic Coverage

The report does not examine impacts and damages occurring outside of U.S. borders. Aside from their own relevance for policy-making, these impacts could affect the U.S. through, for example, changes in world food production, migration, and concerns for national security.
In addition, the primary geographic focus of this report is on the contiguous U.S., with most of the sectoral analyses excluding Hawaii, Alaska, and the U.S. territories. This omission is particularly important given the unique climate change vulnerabilities of these high-latitude and/or island locales. Finally, several sectoral analyses assess impacts in a limited set of major U.S. cities, and incorporation of additional locales would gain a more comprehensive understanding of likely impacts.
Use of Point Estimates

Results in this report are primarily presented as point estimates. For some sectors, ranges are provided based on the design of the underlying modeling analysis (i.e., the approach yields confidence intervals) or because of the scenarios used in that sector. Regarding the latter, the use of wetter and drier climate projections for sectors sensitive to changes in precipitation provides ranges of estimates bounding this uncertainty source. The uncertainties and limitations described in this section, along with others detailed throughout this report and in the underlying CIRA literature, signify that the estimates described in this report should not be interpreted as definitive predictions of future impacts at a particular place and time. The further exploration of these uncertainties, including the development of ranges for all impact projections, will further strengthen the CIRA results.
Photo credits:
- Satellite image of a hurricane: National Oceanic and Atmospheric Administration