Climate Action Benefits: Water Supply and Demand

Water management in the U.S. is characterized by the struggle to balance growing demand from multiple sectors of the economy with increasingly limited supplies in many areas. Unmitigated climate change is projected to have profound impacts on both water availability and demand in the U.S., compounding challenges from changes in demographics, land use, energy generation, and socioeconomic factors. As temperatures rise and precipitation patterns become more variable, changes in regional water demand and surface and groundwater supplies are expected to increase the likelihood of water shortage for many areas and uses.26
On this page:
Additional information:
Key Findings
- Unmitigated climate change is projected to have profound impacts on both water availability and demand in the U.S., compounding challenges from changes in demographics, land use, energy generation, and socioeconomic factors.
- Without global GHG mitigation, damages associated with the supply and demand of water across the U.S. are estimated to range from approximately $7.7-$190 billion in 2100. The spread of this range indicates that the effect of climate change on water supply and demand is highly sensitive to projected changes in runoff and evaporation, both of which vary greatly across future climate projections and by U.S. region.
- Global GHG mitigation is estimated to substantially decrease damages compared to the Reference. Projected benefits under the Mitigation scenario range from $11-$180 billion in 2100, depending on projected future climate. Importantly, global GHG mitigation is projected to preserve water supply and demand conditions more similar to those experienced today.
Risks of Inaction
The effect of climate change on water supply and demand is highly sensitive to projected changes in runoff and evaporation, both of which vary across future climate projections and by U.S. region (Figure 1). Despite these variations, increased damages of unmitigated climate change are projected in the Southwest and Southeast regions under both climate models, and these damages increase over time. These projections are consistent with the findings of the assessment literature.27 Using climate projections from the IGSM-CAM model, the analysis estimates damages at $7.7 billion in 2100. Despite the majority of U.S. regions showing modest increases in welfare (economic well-being) in 2100, the damages in the Southwest and Southeast are much larger in magnitude, and therefore drive the national total. Highlighting the sensitivity of this sector to the climate model used, the drier MIROC model estimates that net damages could be substantially larger, at approximately $190 billion in 2100.
Figure 1. Projected Impacts of Unmitigated Climate Change on Water Supply and Demand
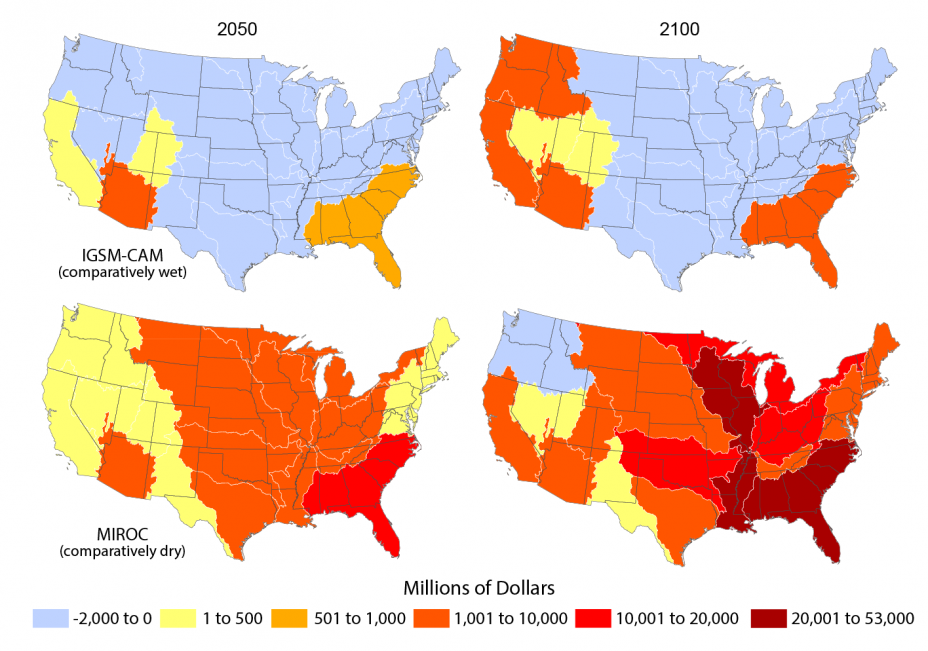 Estimated change in economic damages under the Reference scenario in 2050 and 2100 compared to the historic baseline for the IGSM-CAM and MIROC climate models (millions 2014$). Results are presented for the 18 2-digit hydrologic unit codes (HUCs) of the contiguous U.S. Yellow, orange, and red areas indicate increased damages, while blue areas indicate decreased damages.
download the figure; download the data
Reducing Impacts through GHG Mitigation
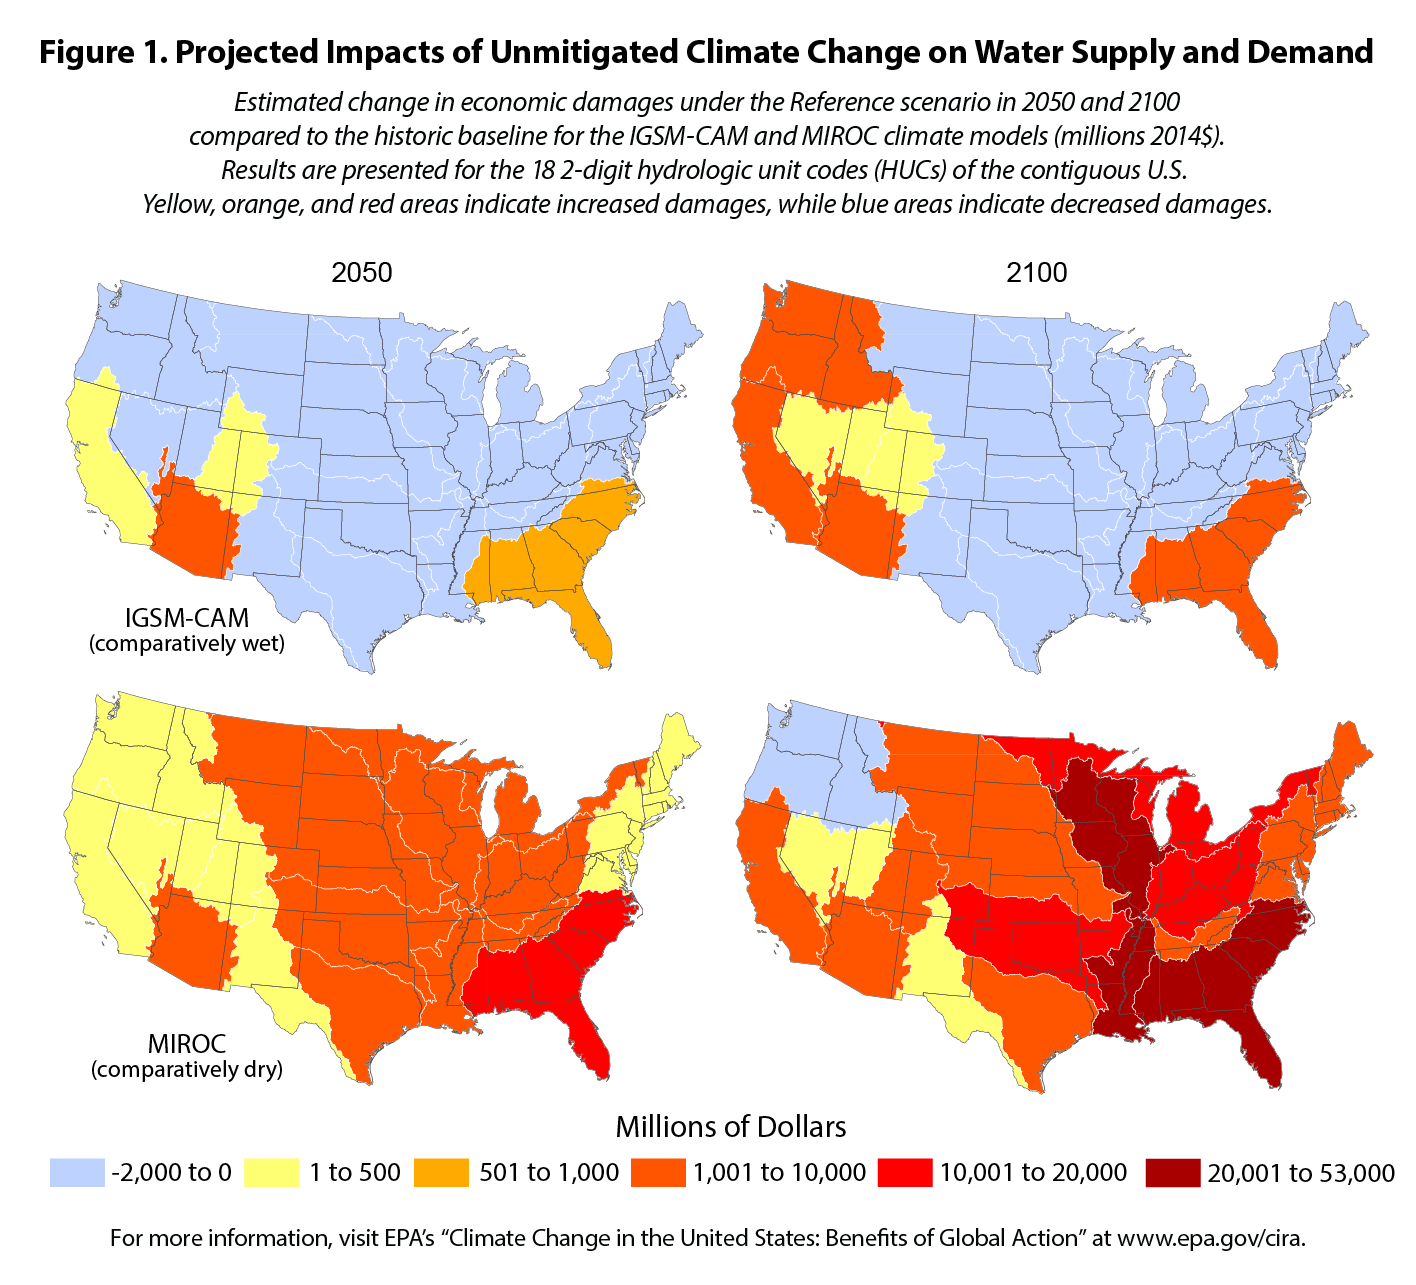
Global GHG mitigation is projected to substantially reduce damages compared to the Reference (Figures 2 and 3), and importantly, preserve water supply and demand conditions more similar to those experienced today. The IGSM-CAM model estimates that damages are $7.7 billion under the Reference scenario in 2100, while the Mitigation scenario results in an increase in welfare (collective economic well-being of the population) of $3.4 billion. Therefore, mitigation is estimated to result in a total increase in welfare of $11 billion in 2100 compared to the Reference. Using the drier MIROC model, the Mitigation scenario yields damages of approximately $19 billion in 2100; however, this represents avoided damages of approximately $180 billion compared to the Reference scenario (numbers do not sum due to rounding).
Figure 2. Economic Damages Associated with Impacts on Water Supply and Demand with and without Global GHG Mitigation
 download the figure; download the data
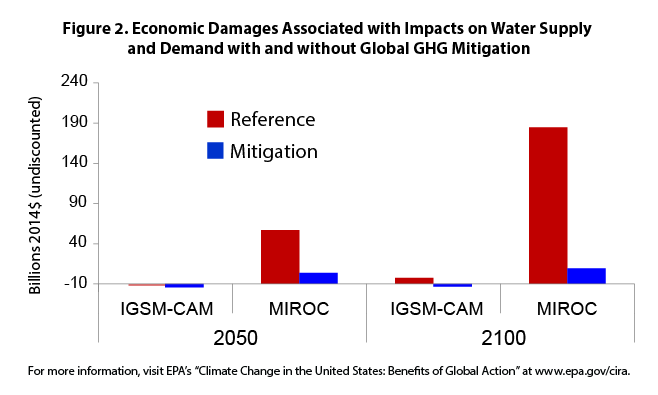
Figure 3. Projected Impacts of GHG Mitigation on Water Supply and Demand
 Estimated percent change in economic damages under the Mitigation scenario in 2050 and 2100 relative to the Reference. Results are presented for the 18 2-digit HUCs of the contiguous U.S. Negative values (shown in green) indicate decreases in damages, or positive economic benefits, due to global GHG mitigation.
download the figure; download the data
Approach
The CIRA analysis estimates the economic impacts associated with changes in the supply and demand of water, based on a national-scale optimization model developed by Henderson et al. (2013).28 The model simulates changes in supply and demand in 99 sub-regions or watersheds of the contiguous U.S. based on changes in runoff and evaporation, population, irrigation demand, and other inputs that vary over time. Economic impact functions are applied for a range of water uses including irrigated agriculture, municipal and domestic water use, commercial and industrial water use, hydroelectric power generation, and in-stream flows.29 The benefits from water use are maximized according to a wide range of constraints, such as storage and conveyance capacities, historic irrigated acreage, and renewable recharge capacity for groundwater. Economic damages are incurred in the model when any one of the water uses specified above does not receive sufficient volume to sustain the baseline activity level. Impacts are summed across all uses in each sub-region and reported as changes in economic welfare. Finally, the optimization model is driven by climate projections from the IGSM-CAM, as well as the MIROC climate model, which projects a drier future for the contiguous U.S. compared to other climate models.30
For more information on the CIRA approach and results for the water supply and demand analysis, please refer to Strzepek et al. (2014)31 and Henderson et al. (2013).32