Climate Action Benefits: Key Findings

Climate change poses significant risks to humans and the environment. The CIRA project quantifies and monetizes the risks of inaction and benefits to the U.S. of global GHG mitigation within six broad sectors (water resources, electricity, infrastructure, health, agriculture and forestry, and ecosystems). Looking across the impact estimates presented in this report, several common themes emerge.1
Global GHG Mitigation Reduces the Frequency of Extreme Weather Events and Associated Impacts
Global GHG mitigation is projected to have a substantial effect on reducing the incidence of extreme temperature and precipitation events by the end of the century, as well as the impacts to humans and the environment associated with these extreme events.2 For example, by 2100 mitigation is projected to avoid 12,000 deaths annually associated with extreme temperatures in 49 U.S. cities, compared to a future with no emission reductions. Inclusion of the entire U.S. population would greatly increase the number of avoided deaths, while accounting for adaptation could reduce this number.
Global GHG Mitigation Avoids Costly Damages in the U.S.

For nearly all sectors analyzed, global GHG mitigation is projected to prevent or substantially reduce adverse impacts in the U.S. this century compared to a future without emission reductions. For many sectors, the projected benefits of mitigation are substantial; for example, in 2100 mitigation is projected to result in cost savings of $4.2-$7.4 billion associated with avoided road maintenance. Global GHG mitigation is also projected to avoid the loss of 230,000-360,000 acres of coldwater fish habitat across the country compared to a future without emissions reductions.
The Benefits of GHG Mitigation Increase over Time
For a large majority of sectors analyzed, the benefits of GHG mitigation are projected to be greater in 2100 than in 2050. In addition, the benefits of GHG mitigation are often not apparent until mid-century. This delay in benefits is consistent with many studies,3 and is attributable to inertia in the climate system. Therefore, decisions we make today can have long-term effects, and delaying action will likely increase the risks of significant and costly impacts in the future.
Adaptation Can Reduce Overall Damages in Certain Sectors

Adaptation can substantially reduce certain impacts of climate change regardless of whether future GHG levels are low or high. For example, the estimated damages to coastal property from sea level rise and storm surge in the contiguous U.S. are $5.0 trillion through 2100 (discounted at 3%4) in a future without emission reductions. When cost-effective adaptation along the coast is included, the estimated damages are reduced to $810 billion.
Impacts Vary across Time and Space
Important regional changes may be masked when results are presented at the national level. For example, the wildfire analysis reveals that the projected changes in the Southwest and Rocky Mountain regions are the primary drivers of national trends of increasing wildfire activity over time.
The temporal scale of climate change impacts is also important. While some impacts are likely to occur gradually over time, others may exhibit threshold (tipping point) responses to climate change, as large changes manifest over a short period of time. For example, high-temperature bleaching events projected to occur by 2025 are estimated to severely affect coral reefs in the Caribbean. Therefore, simply analyzing an impact in one time period (e.g., 2100) may mask important temporal dynamics that are relevant to decision-makers.

This report presents results from the Climate Change Impacts and Risk Analysis (CIRA) project—a large set of sectoral impact models that quantify and monetize climate change impacts in the U.S., with a primary focus on the contiguous U.S., in futures with and without global greenhouse gas (GHG) mitigation. The CIRA analyses are intended to provide insights about the potential direction and magnitude of climate change impacts and the benefits (avoided impacts) to the U.S. of global emissions reductions. Importantly, this report analyzes only some of the impacts of climate change, and therefore estimates just a portion of the total benefits of reducing GHGs. In addition, none of the estimates presented in this report should be interpreted as definitive predictions of future impacts at a particular place or time.
The CIRA analyses do not evaluate or assume specific mitigation or adaptation policies in the U.S. or in other world regions. Instead, they consider plausible scenarios to illustrate potential benefits of significant GHG emission reductions compared to a business-as-usual future. The results should not be interpreted as supporting any particular domestic or global mitigation policy or target. A wide range of global mitigation scenarios could be modeled in the CIRA framework, and results would likely vary based on the details of a particular policy.5 For ease of communicating results, this report focuses on a future where the increase in average global temperature is limited to approximately 2°C (3.6°F) above preindustrial levels – a goal relevant to international discussions on GHG emission reductions (see the Methods of Analysis page for more information).6
This report includes as many climate change impacts as feasible at present, but is not all-inclusive. It is not intended to be as comprehensive as major assessments, such as those conducted by the U.S. Global Change Research Program (USGCRP), which capture a wider range of impacts from the published literature.7 By using a consistent set of socioeconomic and climate scenarios, CIRA produces apples-to-apples comparisons of impacts across sectors and regions – something that is not always achieved, or even sought, in the major assessments. Also, the assessments typically do not monetize damages, nor do they focus on quantifying mitigation benefits. CIRA’s ability to estimate how global GHG mitigation may benefit the U.S. by reducing or avoiding climate change impacts helps to fill an important literature and knowledge gap.
The CIRA analyses do not serve the same analytical purpose nor use the same methodology as the Social Cost of Carbon, an economic metric quantifying the marginal global benefit of reducing one ton of carbon dioxide.8 In addition, the costs of reducing GHG emissions,9 and the health benefits associated with co-reductions in other air pollutants, are well-examined elsewhere in the literature10 and are beyond the scope of this report.
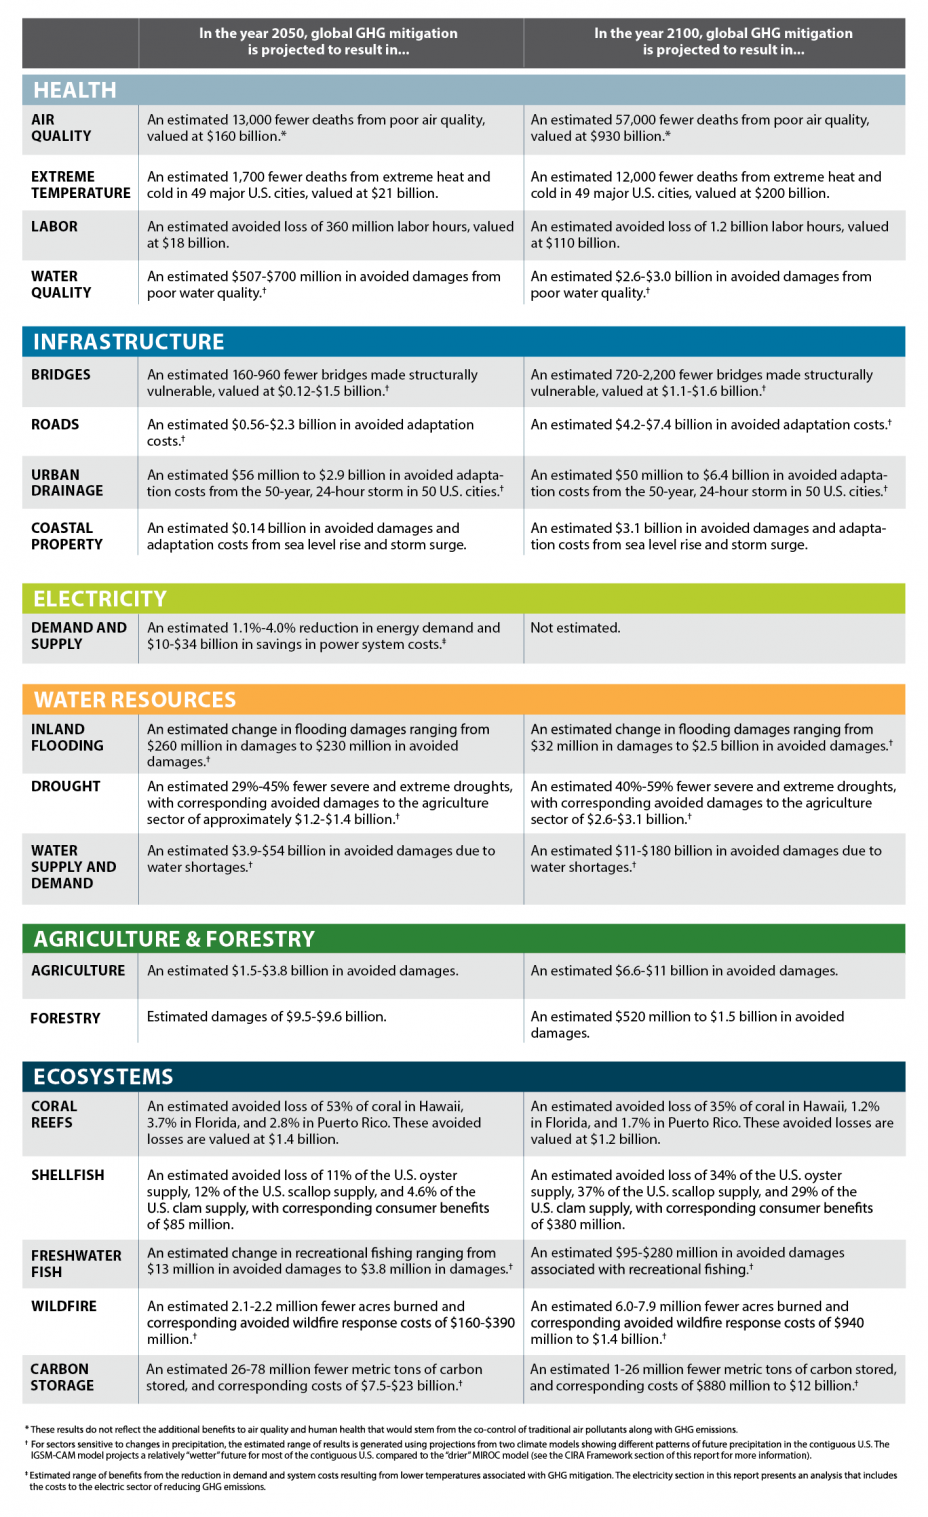
This section provides an overview of the national-scale results presented throughout this report. It presents the estimated physical and monetary benefits (avoided impacts) to the U.S. of global GHG mitigation compared to the Reference scenario in the years 2050 and 2100. Although not available for all sectors, cumulative benefits for the entire 21st century would likely be much larger than the annual estimates presented here. In addition, the individual monetized estimates are not aggregated, as only a subset of climate change impacts is quantified in this report, and there are differences in the types of costs being quantified across the sectors. For detailed information on the results, and a summary of the methodologies used, please refer to the Sectors section of this report.
This section highlights regional impacts of climate change in the U.S. For each sector, the map presents a region where substantial benefits of global GHG mitigation are projected to occur in the years 2050 or 2100.* Note that the geographic scale at which impacts are quantified in the sectoral analyses vary. For example, some of the analyses calculate impacts for large watersheds, while others use the National Climate Assessment regions. For purposes of highlighting regional impacts, this section approximates the regions.