What Do My Sensor Readings Mean? Sensor Scale Pilot Project
EPA is launching a pilot project to test a new tool for making instantaneous outdoor air quality data useful for the public. The new “sensor scale” is designed to be used with air quality sensors that provide data in short time increments–often as little as one minute. EPA developed the scale to help people understand the one-minute data the stations provide and how to use those data as an additional tool for planning outdoor activities.
EPA is testing the scale using data from the community-based Village Green stations, which provide one-minute ozone and particle pollution data for seven U.S. cities. We’re seeking feedback through the end of August 2016.
Once the pilot is complete, EPA will make any necessary improvements to the scale and messages and determine our next steps. Our goal is to make the scale available for use with other sensors later in 2016. Read the documents below to learn more, and send us feedback.
Frequent Questions about the Sensor Scale Pilot Project
- What is the low-medium-high-very high scale?
The tables below show the pilot “sensor scale” for ozone and particle pollution. The low-medium-high-very high scale is designed to help people understand the 1-minute data, and how to use that data as an additional tool for planning their outdoor activities.
In May 2016, EPA launched a four-month pilot project to evaluate a “sensor scale,” using air quality data provided from the Village Green Project, a community-based activity to demonstrate the capabilities of new real-time monitoring technology.
The pilot scales and messages are in the tables below:
Pilot Scales Message Pilot Version
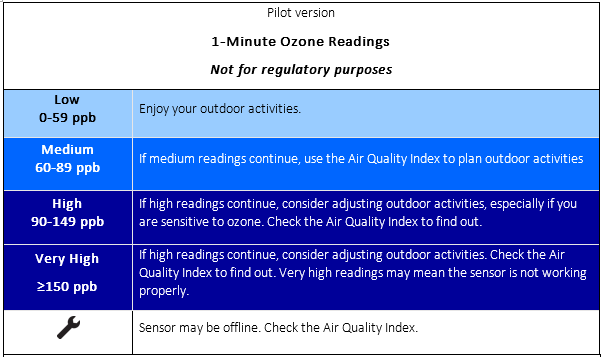
1-Minute Ozone Readings
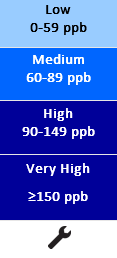
(Not for regulatory purposes)Low
0-59 ppbEnjoy your outdoor activities. Medium
60-89 ppbIf medium readings continue, use the Air Quality index to plan outdoor activities. High
90 -149 ppbIf high readings continue, consider adjusting outdoor activities, especially if you are sensitive to ozone. Check the Air Quality Index to find out. Very High
>= 150 ppbIf high readings continue, consider adjusting outdoor activities. Check the Air Quality Index to find out. Very high readings may mean the sensor is not working properly. 
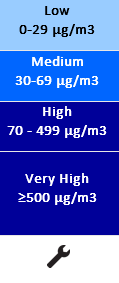
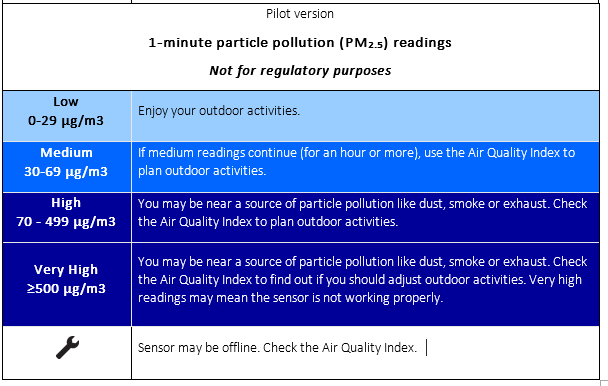
Sensor may be offline. Check the Air Quality Index. Pilot Scales Message Pilot Version 1-minute particle pollution (PM2.5) readings (Not for regulatory purposes) Low
0-29 µg/m3Enjoy your outdoor activities. Medium
30-69 µg/m3If medium readings continue (for an hour or more), use the Air Quality Index to plan outdoor activites. High
70-499 µg/m3You may be near a source of particle pollution like dust, smoke or exhaust. Check the air Quality Index to plan outdoor activities. Very High
>=500 µg/m3You may be near a source of particle pollution like dust, smoke or exhaust. Check the Air Quality Index to find out if you should adjust outdoor activities. Very high readings may mean the sensor is not working properly. 
Sensor may be offline. Check the Air Quality Index.
- What do the low-medium-high-very high categories mean for my health?
Air quality monitors like the ones in the Village Green stations provide a snapshot of air quality – in many cases, a 1-minute snapshot. But scientific studies don’t tell us what a single minute of exposure means for health.
While we can’t tell people what a 1-minute exposure means for their health, we understand that sensor users will want to know how minute-by-minute data might be useful for them. That led EPA to develop the sensor scale – an indication of whether air quality values fall into low, medium or high ranges for ozone or particle pollution. EPA is piloting the scale at Village Green sites in the spring and summer of 2016, with a goal of making it available to any sensor developer. Used in conjunction with the Air Quality Index (AQI), the sensor readings can give you a good idea of when you may want to adjust your outdoor activities to protect your health.
- Can I provide feedback during the pilot?
We want to hear from you! Use your phone or computer to track air quality data and messages from any Village Green station (http://bit.ly/VillageGreenPilot). We’re especially interested in knowing whether the scale and messages are easy to understand, whether they’re helpful to you, and what actions you would take based on the 1-minute data and information. To send us feedback, email us at sensorscalepilot@epa.gov any time before the end of August 2016, or use the online form at feedback.
- Why do the Village Green sites show a low-medium-high-very high scale instead of the Air Quality Index (AQI?)
The real-time monitoring technology at the Village Green sites, like most low-cost air quality sensors being developed, provide a snapshot of air quality -- in many cases, a 1-minute snapshot. The Village Green sites don’t report the Air Quality Index (AQI) for 1-minute readings, because health studies don’t provide information about what a single minute of exposure to ozone or particle pollution means for your health. Both the AQI and EPA’s National Ambient Air Quality Standards are grounded in studies that are based on much longer pollution exposures.
- What is the low-medium-high-very high scale based on?
EPA analyzed millions of air quality data points to develop the scale. The agency examined 1-minute ozone and particle pollution data from the Village Green benches, the agency’s community program to demonstrate the capabilities of new real-time monitoring technology. We also analyzed 1-minute data from regulatory monitors used by EPA and state and local air agencies, where available, along with 1-hour data for particle pollution. Specifically, we looked at the relationship between short-term air quality data (such as 1-minute and 1-hour data) and longer-term data (such as 8-hour and 24-hour data). Longer-term data are more closely related to the results of studies about the health impacts of air pollution. We used Information about those relationships helped us to identify appropriate “breakpoints” for the low, medium and high categories.
Summaries of the air quality analyses, along with details on how EPA established the breakpoints are available at http://bit.ly/VillageGreenPilot
- Can I use the Village Green data to figure out the AQI for my location?
The Village Green stations report ozone and particle pollution data in 1-minute increments, which cannot be used to determine the Air Quality Index (AQI) for ozone or particle pollution. The AQI is based on EPA’s national air quality standards and scientific information about exposure to those pollutants and health.
Are you looking at the Village Green data on your phone? Look for the Air Quality Index logo. You can follow that to see the AQI for your area. (In addition to the 1-minute data for ozone and particle pollution, the Village Green web pages also show the AQI, along with hourly and daily average concentrations.)
- My child has asthma. I just saw a high ozone reading from the Village Green station near me. Should I tell the school to keep him indoors – or at least, not allow him to play at recess?
It’s important to remember that the monitoring technology in the Village Green station provides a snapshot of air quality –a 1-minute snapshot. And health studies currently don’t tell us what a single minute of exposure means for our health.
So before you make decisions about keeping your child indoors or not letting him play outside, check the current Air Quality Index (AQI) for your local area, available at www.airnow.gov. The AQI provides information on air quality and health that can help you make decisions about your outdoor activities. Follow the links on the Village Green website to see the AQI for your area. If you don’t see your local AQI on the Village Green pages, check it at www.airnow.gov.
For ozone, the AQI doesn’t recommend even considering moving children’s activity indoors until ozone reaches “Code Red” – or unhealthy. When that happens, it’s important that children take more breaks and do less intense activities outdoors. You also may want to consider moving longer or more intense activities indoors, or scheduling them for another day – especially if your child is having symptoms.
Remember: exercise is critically important for health. With a little planning, you can make some adjustments when necessary so your child gets exercise while reducing his pollution exposure.
Note: If your child has asthma, be sure he is following his asthma action plan, and keep his quick relief medicine handy. If your child is having symptoms, reducing the level of his activity and going indoors could help. If your child doesn't have an asthma action plan, ask your pediatrician for a plan to help keep your child well.
EPA and the CDC have developed Air Quality and Outdoor Activity Guidance for Schools. It’s available at http://airnow.gov/index.cfm?action=flag_program.activityguid
- I just saw an elevated reading on the Village Green station near me. Can I still go for a run?
Your exposure to pollution is affected by how much pollution is in the air, the amount of time you spend breathing it and your exertion level. You are likely to breathe more rapidly and deeply when exercising, so you will take more pollution into your lungs during exercise – increasing the potential for harm to your health.
If you see elevated readings from a Village Green site, or from a portable air quality sensor, check the current Air Quality Index (AQI) on airnow.gov. If the AQI is in the unhealthy ranges, you may want to reduce the amount of time you do an activity and reduce the intensity of the activity. For example, you could go for a shorter run, or take a walk instead of a run. And always run away from a busy roadway, if you can safely do so. That helps reduce the amount of pollution you’re exposed to, too.
If you are active outdoors when the AQI is in the unhealthy ranges, pay attention. Symptoms such as coughing, a burning sensation in the airways, fatigue or shortness of breath are an indication to reduce your exposure.
- I occasionally see spikes in pollution for a few minutes in the Village Green data. What do those mean for my health?
In general, the science on air pollution and health doesn’t tell us what a few minutes of exposure to an elevated level of pollution will mean for you. But thousands of scientific studies do tell us about the health effects of longer exposures – such as eight hours for ozone, or 24 hours for particle pollution.
If you see brief spikes on the Village Green site or a portable air quality sensor, check the conditions for your area on airnow.gov. AirNow uses an algorithm called a NowCast to convert the current hourly ozone or particle pollution monitor data to the Air Quality Index (AQI), which is shown as a color-coded scale, to provide information about air quality and health that are grounded in science. Used in conjunction with the Air Quality Index (AQI), 1-minute ozone and particle pollution readings can provide information that you can use to make decisions about your location and outdoor activities.
- Why are the AQI numbers on AirNow different than the readings from the Village Green bench?
There are a few reasons the numbers may be different.
- The Village Green stations report a pollution concentration – in parts per billion or micrograms per cubic meter. AirNow reports it in terms of the Air Quality Index (AQI), a color-coded scale known as index value that is designed to help you understand whether air quality is healthy or unhealthy for you. So those numbers aren’t likely to be the same.
- In addition, the air quality information on airnow.gov comes from monitors that are located according to rigorous guidelines to give a picture of air quality for a particular area.
- The Village Green stations measure air in a much smaller location. Depending on where you are (say, next to a bus stop), localized pollution sources may affect your reading.
- I have my own air quality sensor. The information on it is different than the information on AirNow. Which should I rely on?
Both sensors and AirNow give you information on air quality. EPA recommends that you use AirNow for information on air quality and health. Here’s why:
- AirNow reports the current Air Quality Index (AQI) for ozone and particle pollution, two common air pollutants. The AQI is based on EPA’s National Ambient Air Quality Standards and the underlying scientific information about exposure to those pollutants and health. In addition, the monitors that report to AirNow are built and operated according to rigorous air monitoring regulations, and they provide high-quality data. Most low-cost sensors currently do not meet these same data quality standards.
- What your sensor can do is give you helpful information about short-term (such as 1-minute) air quality levels right at your location that you can use to adjust your outdoor activities. For example, do you regularly see elevated particle pollution readings on your walk to work? Move a street over, and see if they improve. If they do, you may want to change your route. Are you seeing elevated ozone readings that are lasting for a while in the afternoon? You might want to switch your afternoon run to the morning, when ozone levels typically are lower, or run on a treadmill at the gym.