AgSTAR Data and Trends
There are 242 anaerobic digesters operating on livestock farms in the United States, helping to reduce greenhouse gas emissions from methane. This page provides national market data and trends related to these biogas recovery systems.
- Potential for anaerobic digestion on livestock farms in the United States
- Anaerobic digester facts and trends
- Biogas facts and trends
- Environmental benefits
- Value of anaerobic digester biogas and coproducts
- State data and trends
You can also find information on individual anaerobic digesters operating on livestock farms in the United States, including:
Potential for Anaerobic Digestion on Livestock Farms in the United States
AgSTAR estimates that biogas recovery systems are technically feasible at over 8,000 large dairy and hog operations. These farms could potentially generate more than 13 million megawatt-hours (MWh) of energy per year and displace about 1,670 megawatts (MWs) of fossil fuel-fired generation.
Use of anaerobic digestion at poultry and beef operations is growing as new technologies enter the market. Although these projects are technically feasible, their economic feasibility can vary.
- Market Opportunities for Biogas Recovery Systems at U.S. Livestock Facilities assesses the market potential for biogas energy projects at dairy and hog farms in the United States.
- Market Opportunities for Biogas Recovery Systems Fact Sheet identifies the top 10 states for energy generation potential from biogas recovery systems at dairy and hog farms.
- Challenges and Opportunities for California’s Dairy Economy (PDF) Exit(149 pp, 6.4 MB, About PDF) explores the potential of dairy biogas systems to reduce environmental impacts while generating energy and/or income for dairies.
Anaerobic Digester Facts and Trends
Anaerobic digesters operating at livestock farms use different technologies to generate power. Complete mix and mixed plug flow designs were used in the majority of anaerobic digesters at livestock farms in 2015.
| System Type | Count | Percentage |
|---|---|---|
| Plug Flow* | 102 | 42% |
| Complete Mix | 90 | 37% |
| Covered Lagoon | 35 | 14% |
| Induced Blanket Reactor | 5 | 2% |
| Anaerobic Sequencing Batch Reactor | 3 | 1% |
| Fixed Film | 2 | 1% |
| Unknown | 5 | 2% |
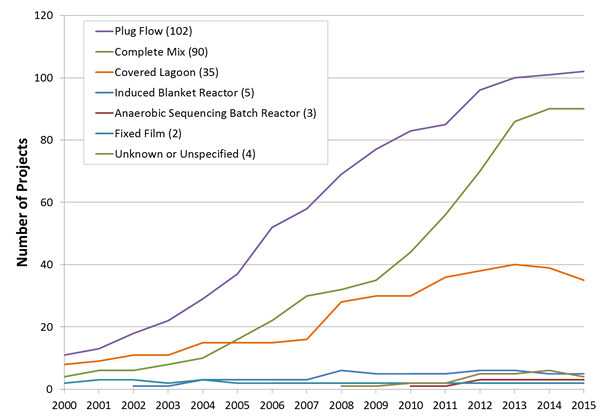 Line chart showing trends in anaerobic digestion system designs from 2000 through 2015. Plug flow and complete mix systems have steadily increased each year and currently make up 80 percent of the project designs.
*Plug flow digesters combine all modified plug flow digesters (for example, mixed plug flow and horizontal plug flow).
Learn more about the type of anaerobic digesters being used at livestock farms:
- The AgSTAR Anaerobic Digester Database identifies the design features of anaerobic digesters at livestock farms in the United States.
- Stories from the Farm highlight experiences of anaerobic digester operators.
Biogas Facts and Trends
Captured and recovered biogas can be used to generate electricity to fuel boilers or furnaces, or to create pipeline quality gas or compressed natural gas that can be sold as a vehicle fuel. While a variety of biogas use options are available, collected biogas is most often used to generate electricity and provide combined heat and power. Combined heat and power generates electricity and uses the excess heat from electricity generation to heat digesters or adjacent buildings.
| End Use | Count | Percentage |
|---|---|---|
| Combined Heat and Power (CHP) | 122 | 50% |
| Electricity | 82 | 34% |
| Boiler/Furnace Fuel | 16 | 7% |
| Flared Full Time | 15 | 6% |
| Unknown | 7 | 3% |
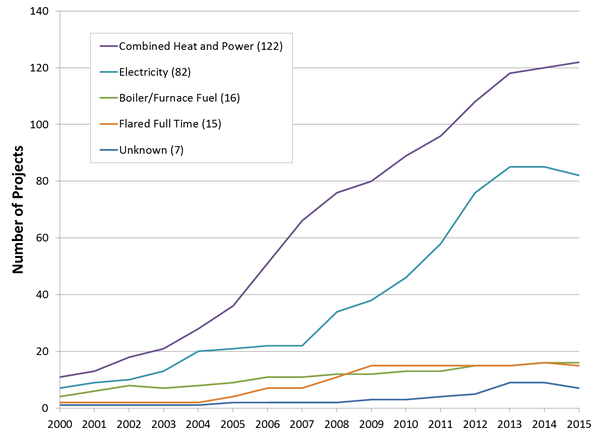 Line chart showing trends in the end uses of biogas from 2000 through 2015. Combined heat and power is the most common end use, followed by electricity. Since 2003, combined heat and power and electricity have steadily increased each year. Boiler and furnace fuel has also increased, but at a much slower rate. Projects that flare the biogas full time make up approximately 6 percent of all projects in 2015.
Environmental Benefits
- In 2015, anaerobic digesters on livestock farms reduced GHG emissions by 3.0 million metric tons of CO2 equivalent (MMTCO2e).
- 2.46 MMTCO2e direct methane reductions
- 0.56 MMTCO2e emissions avoided
- Since 2000, anaerobic digesters on livestock farms have reduced direct and indirect emissions by 20.85 MMTCO2e.
- In 2015, energy generation from anaerobic digesters on livestock farms was approximately 981 million kilowatt hours (kWh) equivalent.
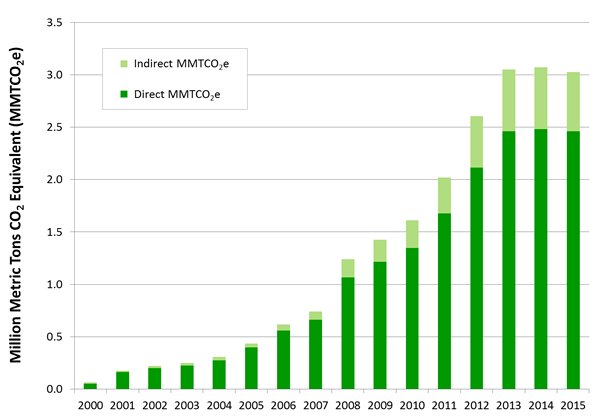 Column chart showing the amount of direct and indirect greenhouse gas emission reductions from anaerobic digesters on livestock farms from 2000 through 2015. The chart shows a steady increase through 2013 with an estimated total of 3.00 MMTCO2e in 2015.
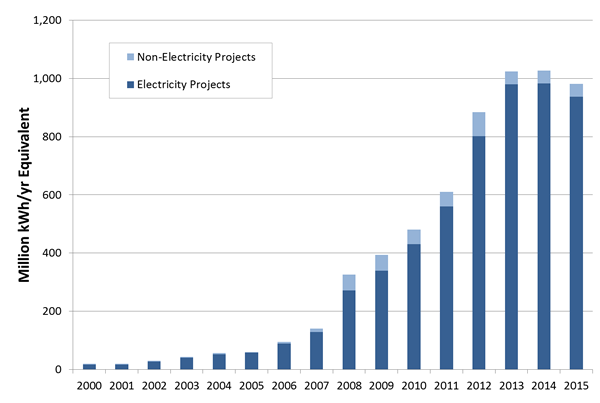 Column chart showing rnergy generation from electricity projects and non-electricity projects on livestock farms from 2000 through 2015. The chart shows a gradual increase from 2000 through 2007 and then a more significant increase from 2007 through 2014. In 2015, AD systems on livestock farms generated the equivalent of approximately 981 million kilowatt hours of electricity.
Value of Anaerobic Digester Biogas and Coproducts
The Innovation Center for U.S. Dairy Exit provides information about production possibilities and market values of the products from mature anaerobic digesters.
State Data and Trends
State Data Sources
- The Database of State Incentives for Renewable Energy (DSIRE) Exit is a comprehensive source of information on state, local, utility and selected federal incentives that promote renewable energy.
- The State Energy Portal Online for Consumers Exit provides a comprehensive view of energy data and information. The tool can help you compare state energy data and rankings, customize maps and charts, and view state rankings of energy production, consumption, prices, and more.
Renewable Portfolio Standards
A state renewable portfolio standard (RPS) encourages or requires utilities to use or buy renewable energy or renewable energy certificates (RECs) to account for a certain portion of their retail electricity sales by a certain date. A REC is a tradable certificate documenting that 1 megawatt-hour of renewable electricity was generated at a specific facility. The goal of an RPS is to stimulate market and technology development so that renewable energy can become more competitive with conventional forms of electric power. A state RPS helps create market demand for renewable energy.
Generally, electricity suppliers can meet the RPS targets by:
- Owning a renewable energy facility and its output generation.
- Purchasing RECs.
- Purchasing electricity from a renewable facility.
Biogas from anaerobic digesters often qualifies as renewable energy under the biomass category of state RPS systems.
Additional information on states with RPS targets is available from the following sources:
- The National Conference of State Legislatures, 2014 update Exit provides state-by-state RPS information.
- The Database of State Incentives for Renewable Energy (DSIRE) Exit summarizes state RPS policies and can help you determine whether and how biogas recovery can meet your state RPS standard.
Feed-in Tariffs
- Feed-in tariffs (FIT) Exit are a policy tool used to encourage renewable electricity technologies. A FIT program typically guarantees that customers who own a FIT-eligible renewable electricity generation facility will receive a set price from their utility for all of the electricity they generate and provide to the grid.