ACE: Environments and Contaminants - Criteria Air Pollutants
Indicator E1
Data characterization
- Data for this indicator are obtained from EPA’s database of air quality monitoring measurements.
- Air pollution monitors are placed in locations throughout the country, with an emphasis on areas expected to have higher pollutant concentrations or that have larger populations. Not all counties in the United States have air pollution monitors, and the number of counties with monitors has changed over time.
- Monitors generally tend to stay in the same location over many years, but there may be some limited changes in the number or location of monitors providing data from year to year.
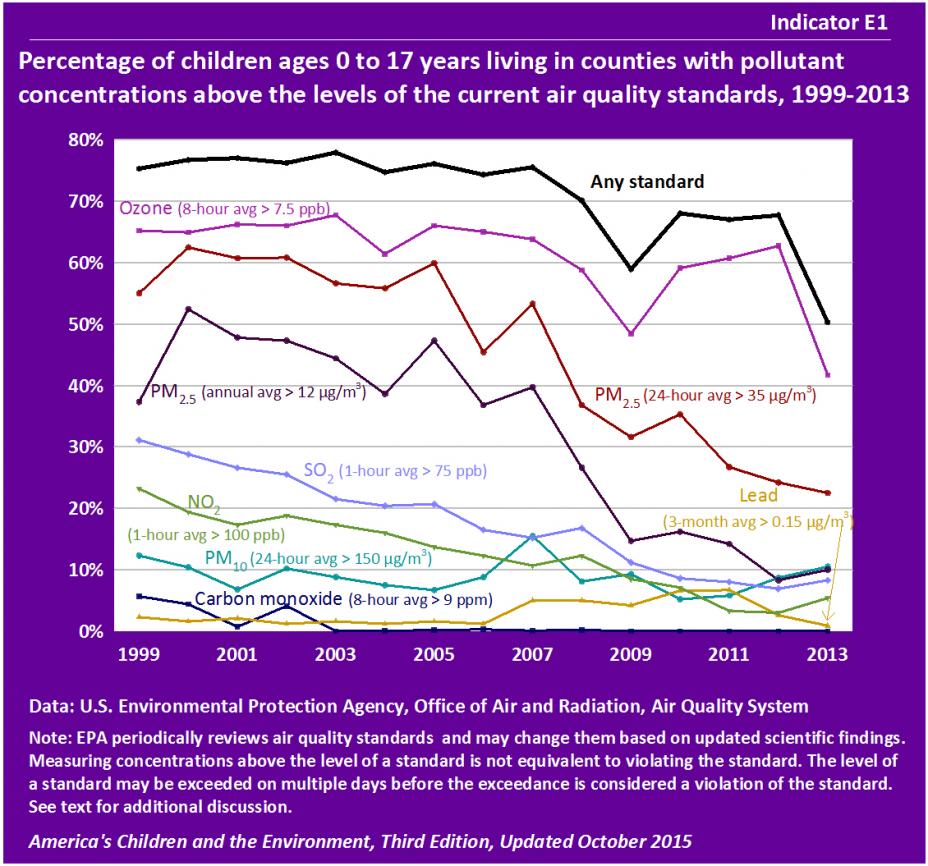
- From 1999 to 2013, the proportion of children living in counties with measured pollutant concentrations above the levels of one or more national ambient air quality standards decreased from 75% to 50%. This includes both concentrations above the level of any current short-term standard at least once during the year as well as average concentrations above the level of any current long-term standards.
- The decreasing trend over the years 1999–2013 was statistically significant.
- From 1999–2013, the percentage of children living in counties with measured ozone concentrations above the level of the current 8-hour ozone standard at least one day during the year decreased from 65% to 42%.
- The decreasing trend for ozone over the years 1999–2013 was statistically significant.
- From 1999–2013, the percentage of children living in counties with measured PM2.5 concentrations above the level of the current 24-hour PM2.5 standard at least once per year decreased from 55% to 22%. Over the same years, the percentage of children living in counties with a measured annual average concentration above the level of the current annual PM2.5 standard declined from 37% to 10%.
- The decreasing trends for PM2.5 were statistically significant.
- From 1999–2013, the percentage of children living in counties with measured sulfur dioxide concentrations above the level of the current one-hour standard for sulfur dioxide at least one day per year declined from 31% to 18%. Over the same years, the percentage of children living in counties with measured concentrations above the level of the current one-hour standard for nitrogen dioxide at least one day per year decreased from 23% to 5%.
- The decreasing trends for both sulfur dioxide and nitrogen dioxide were statistically significant.
- In each year since 1999, between 1 and 7% of children lived in counties with measured ambient lead concentrations above the level of the current three-month standard for lead. In 2013, 7 counties with 1% of U.S. children reported concentrations above the level of the three-month standard for lead.
- In 2013, 11% of children lived in counties with measured PM10 concentrations above the level of the current 24-hour standard for PM10 at least one day per year, and no children lived in counties with measured concentrations above the level of the current standard for carbon monoxide.
Indicator E2
Data characterization
- Data for this indicator are obtained from EPA’s database of air quality monitoring measurements.
- Air pollution monitors are placed in locations throughout the country, with an emphasis on areas expected to have higher pollutant concentrations or that have larger populations. Not all counties in the United States have air pollution monitors.
- Some air pollution monitors do not operate every day, so some days with pollutant concentrations above the levels of the air quality standards may not be identified.
- In 2009, 27% of children lived in counties with no monitoring data for ozone, and 30% lived in counties with no monitoring data for PM2.5.
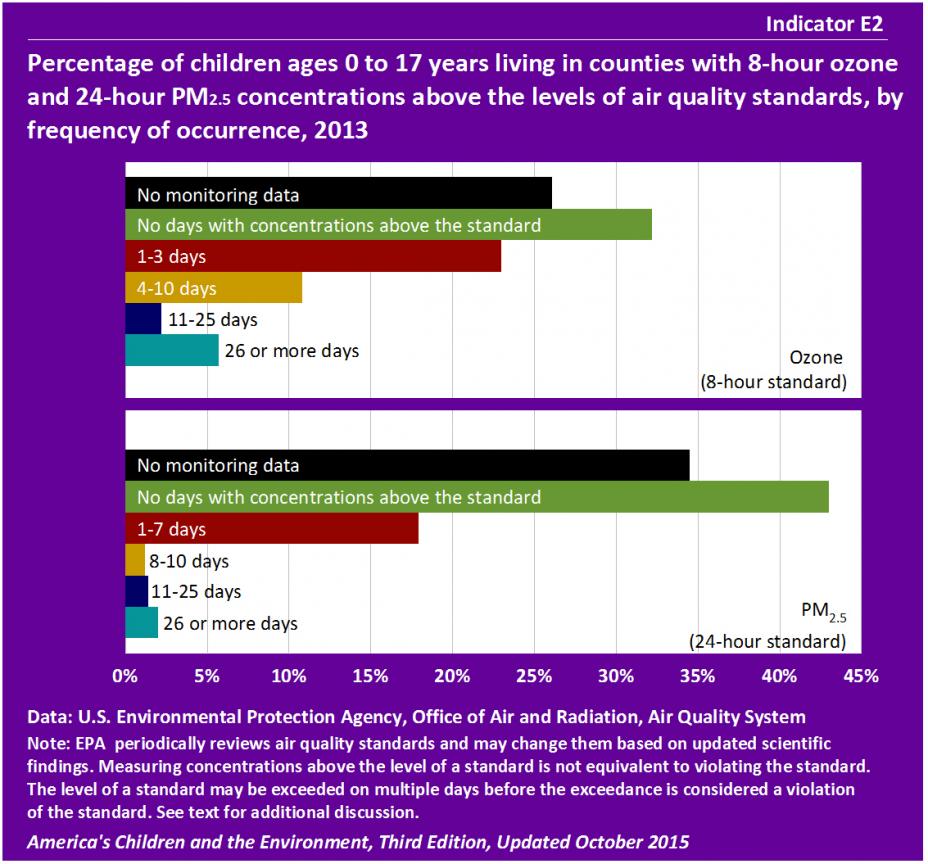
- In 2013, 6% of children lived in counties with measured ozone concentrations above the level of the 8-hour ozone standard on more than 25 days. An additional 2% of children lived in counties with measured concentrations above the level of the ozone standard between 11 and 25 days, and 11% of children lived in counties where concentrations were above the level of the standard between 4 and 10 days.
- In 2013, 2% of children lived in counties with measured PM2.5 concentrations above the level of the 24-hour PM2.5 standard on more than 25 days. An additional 1% of children lived in counties with measured concentrations above the level of this standard between 11 and 25 days, and 1% of children lived in counties with measured concentrations above the level of the 24-hour PM2.5 standard between 8 and 10 days.
- In 1999, 23% of children lived in counties with measured ozone concentrations above the level of the current 8-hour ozone standard on more than 25 days. An additional 27% of children lived in counties with measured concentrations above the level of the ozone standard between 11 and 25 days, and 11% of children lived in counties where concentrations were above the level of the standard between 4 and 10 days. (See Table E2)
- In 1999, 6% of children lived in counties with measured PM2.5 concentrations above the level of the current 24-hour PM2.5 standard more than 25 days. An additional 9% of children lived in counties with measured concentrations above the level of this standard between 11 and 25 days, and 3% of children lived in counties with measured concentrations above the level of the 24-hour PM2.5 standard between 8 and 10 days. (See Table E2)
Indicator E3
Data characterization
- Data for this indicator are obtained from EPA’s database of daily Air Quality Index (AQI) values for each county in the United States.
- Air pollution monitors are placed in locations throughout the country, with an emphasis on areas expected to have higher pollutant concentrations or that have larger populations.
- AQI values are based on daily monitoring data for up to five criteria air pollutants. Some counties do not have monitors, and some monitors do not operate every day, so some days do not have AQI values.
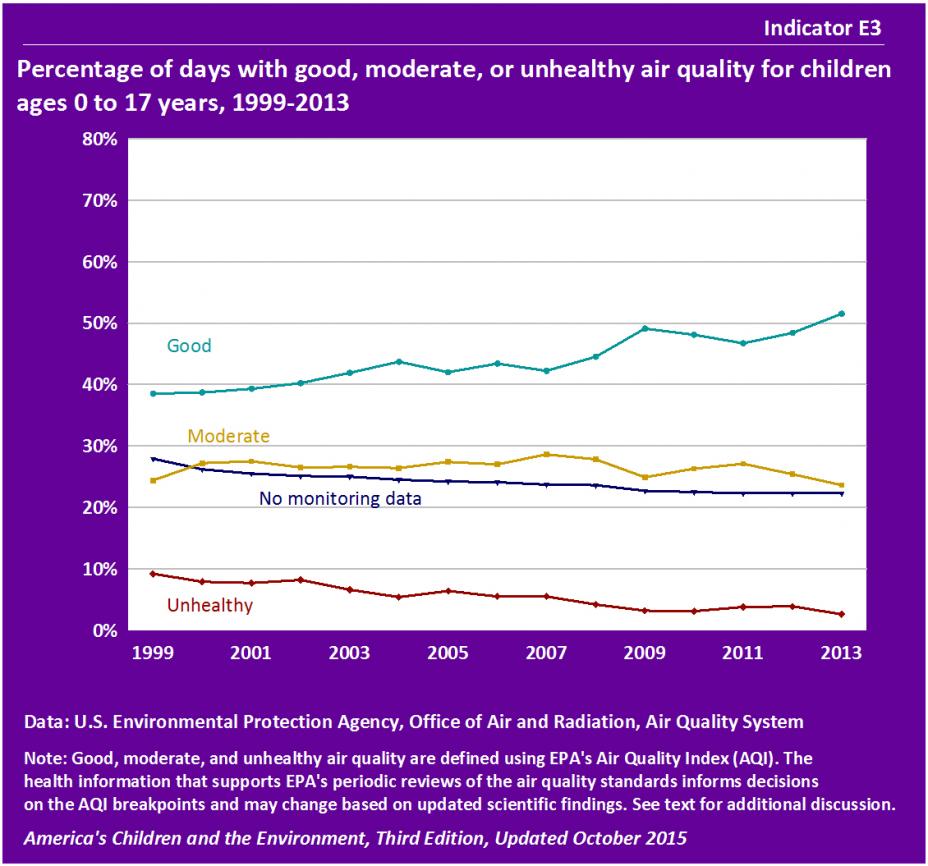
- For this indicator, the available monitoring data are used to assign a value of “good,” “moderate,” “unhealthy,” or “no monitoring data” for each day in each U.S. county.
- The percentage of children’s days that were designated as having “unhealthy” air quality decreased from 9% in 1999 to 3% in 2013. The percentage of children’s days with “good” air quality increased from 39% in 1999 to 52% in 2013. The percentage of children’s days with “moderate” air quality was approximately constant at 24–29% from 1999 to 2013.
- The 1999 to 2013 trends in “unhealthy” and “good” air quality days were statistically significant.
About the Criteria Air Pollutants Indicators
Indicators E1 and E2 present information about children living in counties with air pollutant concentrations above the level of air quality standards and Indicator E3 presents information about air quality ratings across all counties each year. The data for Indicators E1 and E2 are from a database that compiles air monitoring measurements from around the country each year. The data for Indicator E3 are from a database that provides a rating of the air quality for each county on each day.
- Indicator E1 presents the percentage of children ages 0 to 17 years living in counties with pollutant concentrations above the levels of the current air quality standards from 1999 - 2013.
- Indicator E2 presents the percentage of children ages 0 to 17 years living in counties with an 8-hour ozone and 24-hour PM2.5 concentrations above the levels of air quality standards, by frequency of occurrence, in 2013.
- Indicator E3 presents the percentage of days rated good, moderate, or unhealthy air quality for children ages 0 to 17 years from 1999-2013.
Air pollution contributes to a wide variety of adverse health effects. The six most common air pollutants are called “criteria” air pollutants and include carbon monoxide, lead, ground-level ozone, particulate matter, nitrogen dioxide, and sulfur dioxide. Exposure to these pollutants has been associated with health effects like coughing and wheezing, aggravation of respiratory illnesses such as asthma, and neurodevelopmental effects (for lead). Children may be particularly susceptible to adverse effects because their lungs and other organ systems are still developing and because they may experience higher exposure due to their activities such as outdoor play.
EPA has established national ambient air quality standards (NAAQS) for the criteria pollutants. The standards are set at a level to protect public health, including the health of at-risk populations such as children. Some of the standards are designed to protect against adverse health effects that can happen after exposure for a short time (e.g., ozone concentrations averaged over 8 hours) and others are designed to protect against effects from more long term exposure (e.g., rolling three month lead concentrations).
Indicators E1 and E2 present data on children living in counties with concentrations of criteria pollutants above the levels of the standards from the EPA Air Quality System (AQS) database. Indicator E3 presents data on air quality for children from EPA’s Air Quality Index (AQI).
More information about criteria air pollutants and Indicators E1, E2, and E3 is provided in the updated Criteria Air Pollutants section of America's Children and the Environment, Third Edition.
Related Links
U.S. EPA: Air Quality: EPA's Integrated Science Assessments (ISAs)
Summary of Methods - Criteria Air Pollutants
State and local environmental agencies throughout the country operate monitors that measure concentrations of criteria pollutants in outdoor air. EPA compiles these measurements in the Air Quality System (AQS) database. For Indicators E1 and E2, these criteria pollutant measurements are compared to the levels of the National Ambient Air Quality Standards (NAAQS), established by EPA under the Clean Air Act. Indicator E3 uses EPA’s Air Quality Index (AQI), which is calculated from data in the AQS database. The AQI is based on daily measurements of all the criteria pollutants except for lead.
Indicator E1 uses the AQS data to present the percentage of children ages 0 to 17 living in counties that have measured concentrations of a pollutant greater than the level of the current NAAQS for each criteria pollutant. Indicator E2 uses the AQS data to present the percentage of children ages 0 to 17 living in counties that have measured concentrations greater than the level of the current NAAQS for two particular criteria air pollutants: ozone and PM2.5.
Indicator E3 uses the AQI to present the percentage of days in each year considered to be in the categories of “good,” “moderate,” or “unhealthy” air quality for children ages 0 to 17.
Detailed Methods for Indicators E1, E2, and E3
Metadata for Air Quality System (AQS)
Metadata for Census: Decennial Data
Metadata for Census: Intercensal and Postcensal Data