Green Power Partnership Program Success Metrics
Since 2001, when the Green Power Partnership started, the program has made considerable progress in addressing market barriers to green power procurement. By offering technical resources and recognizing environmental leadership, the Partnership brings value to its Partners.
At the end of 2015, more than 1,300 Partners were collectively using more than 30 billion kilowatt-hours (kWh) of green power annually, equivalent to the electricity use of more than three million average American homes.
Included below are some additional analyses of the Partnership's metrics.
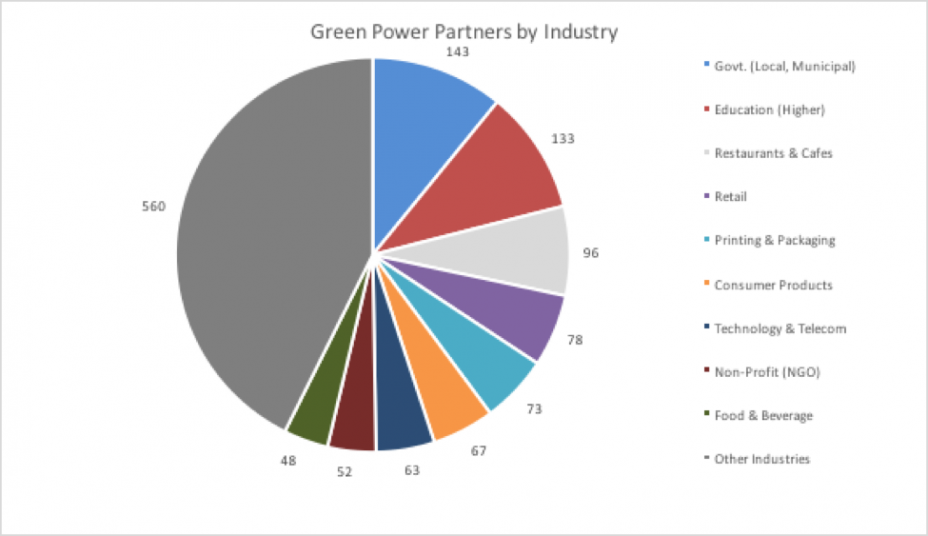
- Green Power Partners by Industry
- Green Power Usage by Industry
- Green Power Partners by Electricity Loads
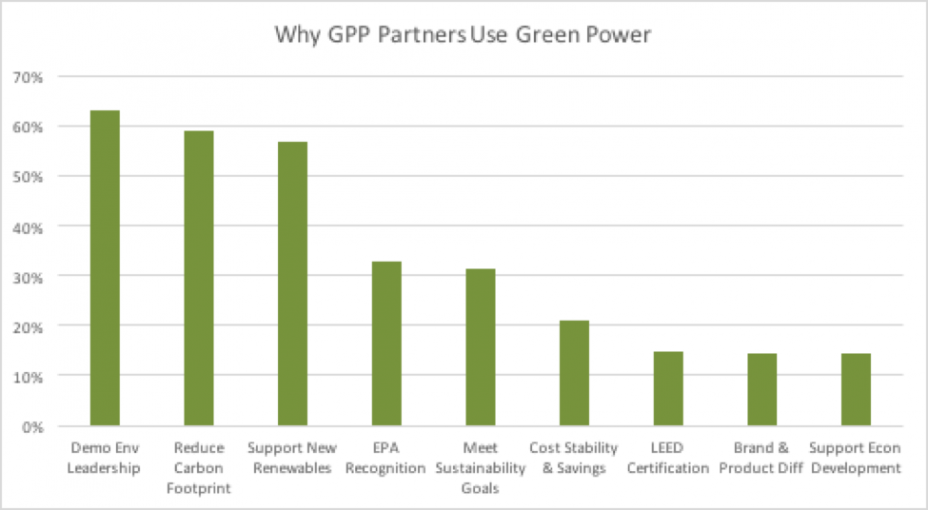
- Why GPP Partners Use Green Power
- Resource Mix by Product Type
- Annual Green Power Use by Product Type
Green Power Partners by Industry
This pie chart details the distribution of our Partners by their primary industry sector. The largest numbers of Partners are in the Local Government and Higher Education sectors.
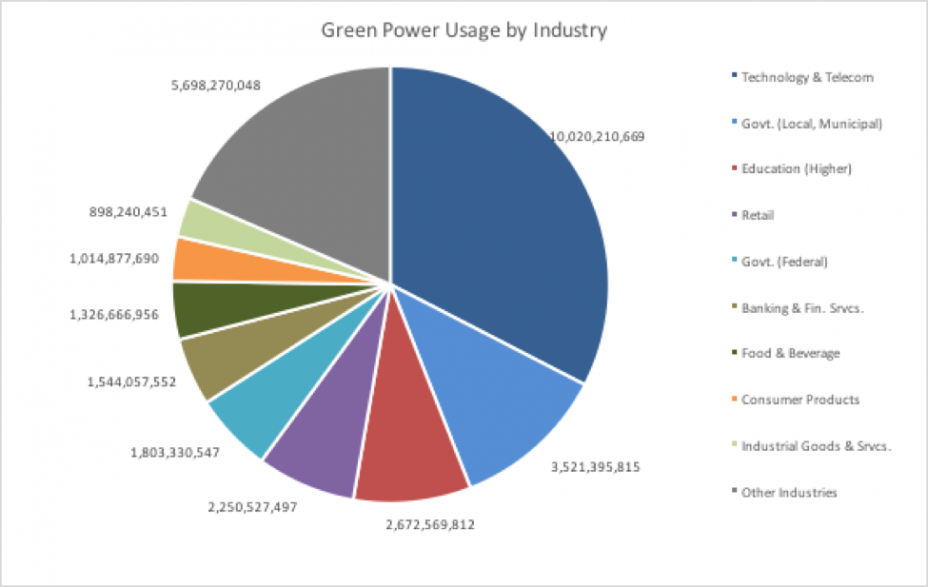
Green Power Usage by Industry
This pie chart breaks out total green power use in kilowatt-hours (kWh) by primary industry sector. The Technology and Telecom sector is the largest user of green power in the Green Power Partnership, followed by Local Government, Higher Education, and Retail sectors.
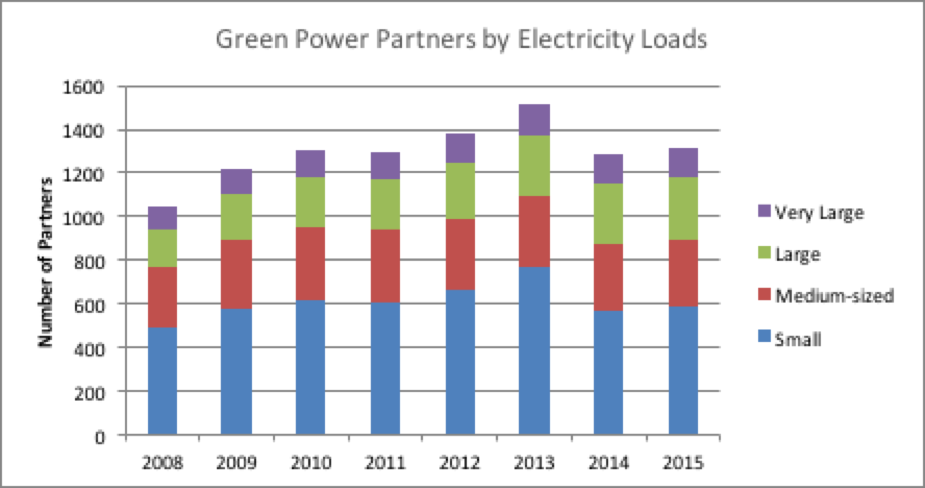
Green Power Partners by Electricity Loads
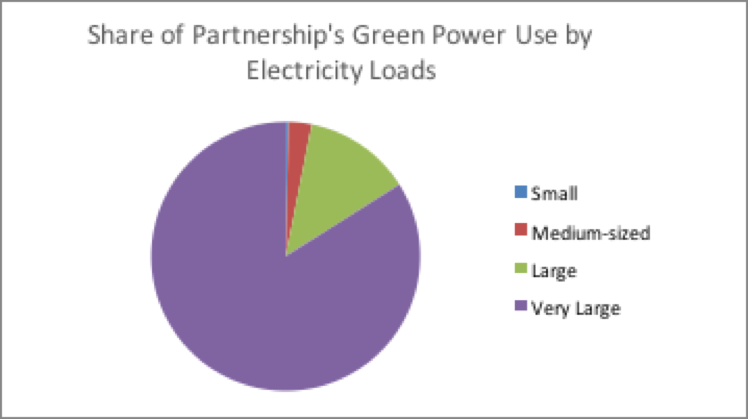
While the Partnership has a higher number of Partners with small electric loads, the largest share of the Partnership's green power use is by very large electricity users (see pie chart).
Medium ranges from 1–10 million kWh/year, and
Small is less than 1 million kWh/year.
Why GPP Partners Use Green Power
Current EPA Partners indicate that demonstrating environmental leadership, reducing one's carbon footprint, and supporting renewable energy development are the primary reasons given for why they use green power. Below is a summary of the reasons (Partners can check multiple reasons) why our Partners use green power.
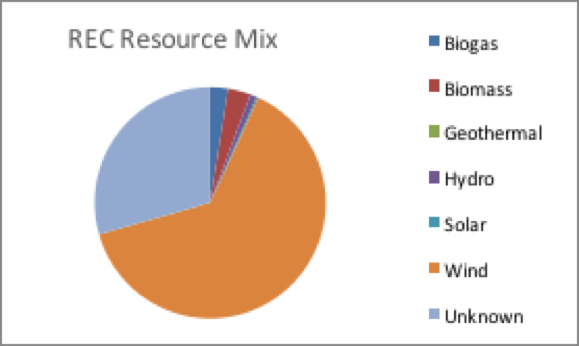
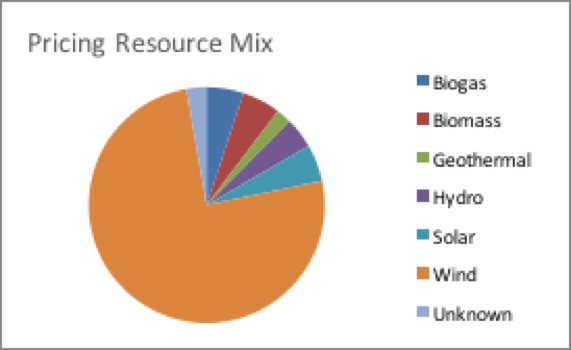
Resource Mix by Product Type
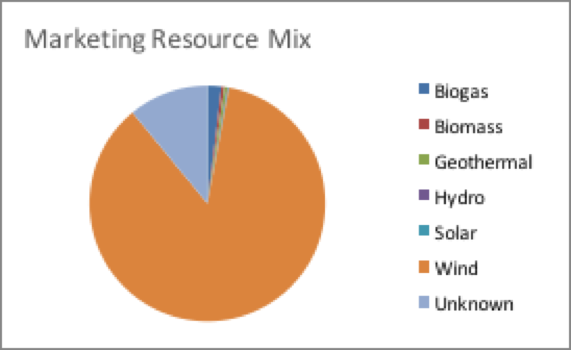
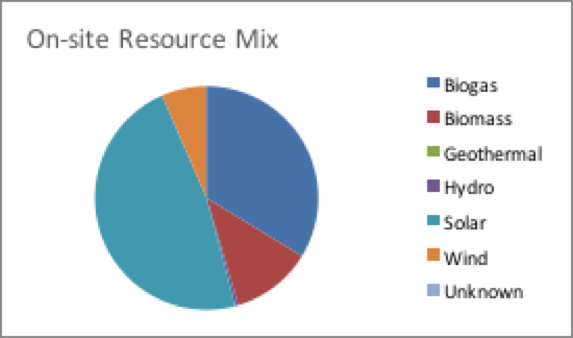
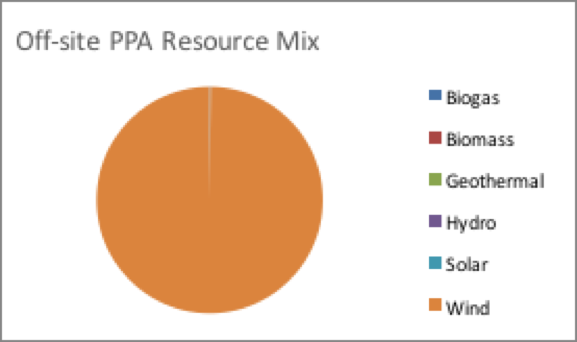
The following pie charts detail the resource mix across each of the predominant green power supply options available to Partner organizations; these include renewable energy certificates (RECs), green pricing, green marketing, on-site generation, and off-site power purchase agreements.
 |
 |
 |
 |
 |
|
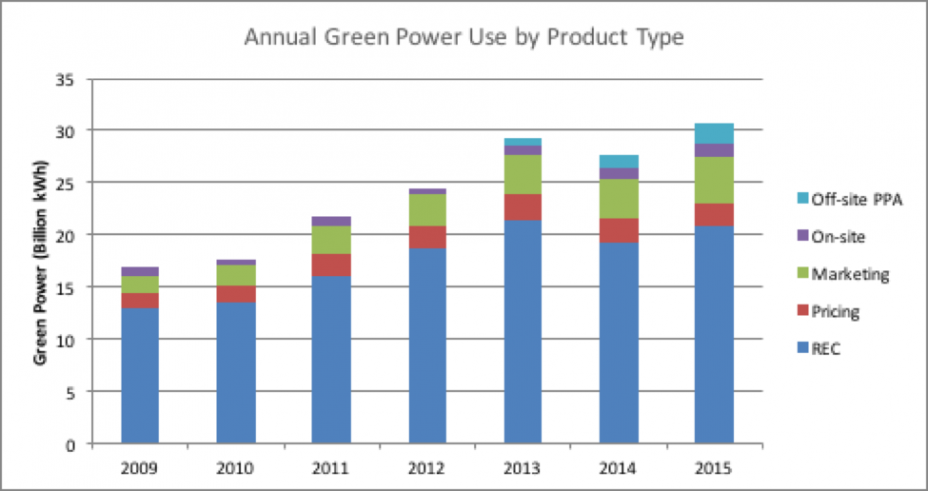
Annual Green Power Use by Product Type
The following stacked bar chart highlights the year-over-year changes in product mix. Unbundled RECs represent the product type most used by Partners. Direct project engagement through off-site power purchase agreements (PPAs) is a fast growing product segment.
