TRI.NET User's Guide: Trends
On this page:
Trend queries in TRI.NET present TRI data by year over multiple years. They can be used to look at changes in TRI reporting over time.
Trends Data
Trend queries in TRI.NET are run from datasets containing multiple years of TRI data. There are two multiple year datasets distributed with the 2009 National Analysis (NA):
| Dataset Name | Description |
|---|---|
| TRI 2001-2009: NA 2009 | Database with tables for years 2001-2009. Use for trends by filtering by Year. This is a common trend period for TRI analyses. For trends over 1988-2009 use the all-in-one database, TRI 1988-2009: NA 2009. |
| TRI 1988-2009: NA 2009 | All-in-one database for all 22 years of TRI data: 1988-2009. Use for trends over multiple years by filtering by Year(s). This database can be used for all analyses, including single year analyses, but the software will be slower going through the large database; for best performance analyzing a single year, download the database for that year. |
These datasets can be installed by using the Auto-Updater feature of TRI.Net; see Updating Data and Software.
Running the trend
Trend queries are built and run like all other TRI.NET queries. However, they include multiple years of data and require the GROUPING variable, "Year," to be included in results.
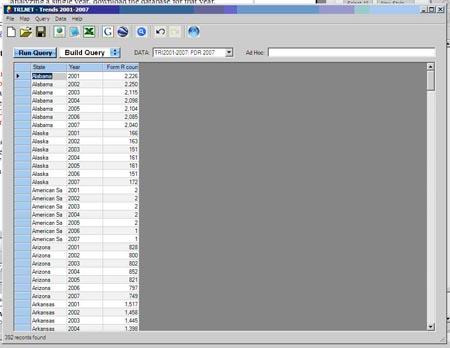
For example, suppose you are interested in the trend in Form R Count reported by facilities in each State over the Years 2001-2009. In the Build Query interface, check the GROUPING variables "State" and "Year" and the DATA variable "Form R Count." Then click "Run Query." Your results will present a count of Form Rs submitted by State and Year.

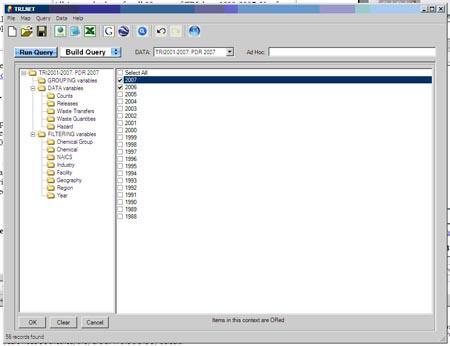
By default, results for all years in the database are presented. To limit a query to a subset of years, for example, 2006 to 2007, check those years in the FILTERING variable, "Year." The multiple year databases can also be used for a single year by checking just that year.

Trend Analysis
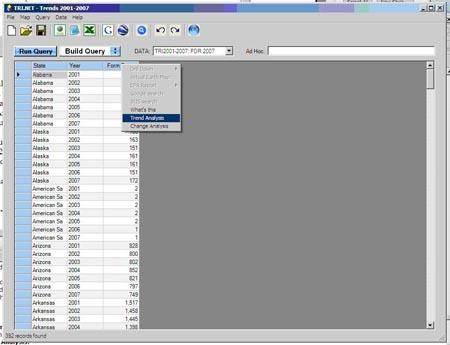
After running a trend query, you can run a Trend Analysis to view the yearly trend for a numeric data element in your results. To run a Trend Analysis, right-click on a column header for the data element and select "Trend Analysis." Note that the GROUPING variable, Year, must be included in your query to run a Trend Analysis.
For example, suppose you have run a query presenting the Form R Count by State and Year for years 2001-2009. To view the trend in Form R Count over time, right-click on the column header for Form R Count and click "Trend Analysis."

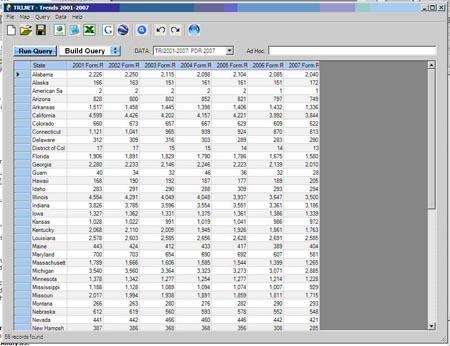
Your results will then show a row for each State and a column containing the Form R Count for each Year in the dataset.

Change Analysis
After running a trend query, you can also run a Change Analysis to view the year-to-year change and percent change by year for a numeric data element in your results. To run a Change Analysis, right-click on a column header for the data element and select "Change Analysis." Note that the GROUPING variable, Year, must be included in your query to run a Change Analysis.
For example, suppose you have run a query presenting the Form R Count by State and Year for 2001-2009. To view the year-to-year change and percent change by year Form R Count over time, right-click on the column header for Form R Count and click "Change Analysis."
Like Trend Analysis Results, your results for a Change Analysis will then show a row for each State and a column containing the Form R Count for each Year in the dataset. In addition, your results for the Change Analysis will show year-to-year and percent change for each pair of subsequent years.
