TRI.NET User's Guide: Build Query
On this page:
- Build Query Interface
- Choose Year
- GROUPING variables
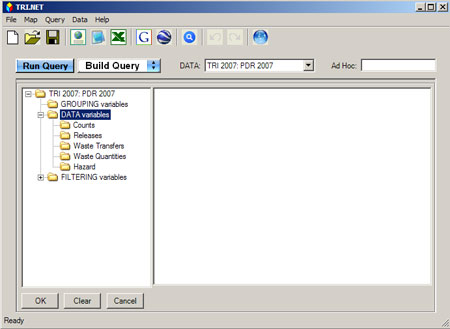
- DATA variables
- FILTERING variables
- My TRI Neighborhood
The Build Query menu is used to define the query and subsequent report that you want to generate. Use this tool to select the variables, the level of aggregation, and the conditions or filters that you want in your report. To open the Build Query menu, click the Build Query button.
The following section describes how each folder in the Build Query menu can be used to construct the desired query.
Build Query Interface
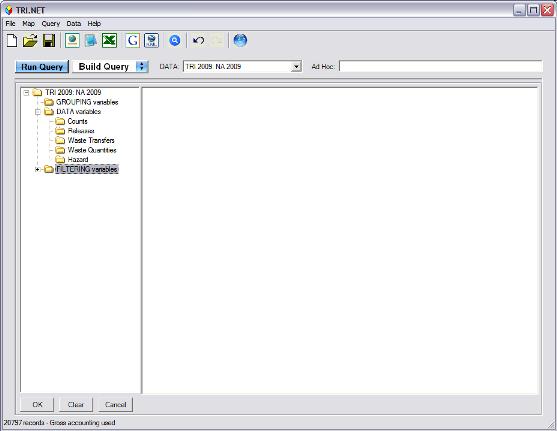
Query variables are presented in hierarchical folders. If there is a plus  or minus sign
  to the left of a folder, it contains subfolders. You can view the subfolders within a folder, by clicking on the plus sign. You can hide the subfolders within a folder, by clicking on the minus sign.
The illustration below displays the Build Query Interface with DATA variables subfolders shown, and FILTERING variables subfolders hidden:
If there is no plus or minus sign to the left of a folder, the folder contains variables. You can view the variables within a folder by clicking on the folder itself. Variables will appear in the right-hand pane of the screen. You can select a variable to be used in the query by checking the box to the left of the variable.
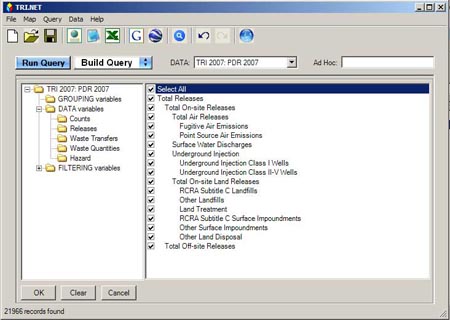
The Build Query Interface with the DATA variable "Total Air Releases" selected:

You can select all variables within a list by checking "Select All."
Choose Year
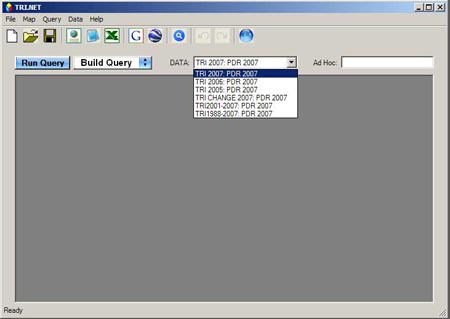
You can choose which year or years of data you want to analyze. This is done by selecting the dataset under "Data." By default, the latest year of data is selected.
Note: The initial download version of the tool comes with data for the most recent reporting year (e.g., TRI 2007: PDR 2007). Additional years of data can be downloaded by clicking the "Data Menu" and selecting "Get Data," or by clicking the "Get Data" icon. You can also download a trends file (e.g., TRI 1988-2007: PDR 2007). The trends file includes data for all reporting years, and can be used to compare different metrics across all years. See Updating Data and Software for more detail on available data.
GROUPING Variables
GROUPING variables specify how the DATA variables are to be aggregated. For example, if you select TRIFID as the only GROUPING variable, and then select Form R Count as the DATA variable, the results will include a count of Form Rs for every TRI Facility ID. You can select one or more GROUPING variables. The Select All box can be checked to return all GROUPING variables in the output.

Query results will be aggregated in the same order as the selected GROUPING variables are presented in Build Query. For example, if Chemical, Industry, and Zip are selected for the GROUPING variables, and Form R Count as the DATA variable, the results will include a count of Form Rs by ZIP code, by Industry, and by Chemical.

DATA Variables
DATA variables are the variables to be aggregated and presented in the output. There are five DATA variable types: Counts, Releases, Waste Transfers, Waste Quantities, and Hazard. Multiple DATA variables can be selected from one or more DATA variable types. For example, a custom report might include a Form R Count, the total Surface Water Discharges, the total Transfers to POTWs Non Metals, and total Waste Transfers to POTWs (Metal and Metal Compounds). The Select All box can be checked to return all variables in one DATA variable type.

FILTERING Variables
FILTERING variables restrict the data that get aggregated and presented in the results. There are eight different FILTERING variable types available: Chemical Group, Chemical, NAICS, Industry, Facility, Geography, Region, and Year. They are used to restrict outputs to data of interest. For example, you can use FILTERING variables to limit the results of a query to a specific chemical, a list of chemicals, or a chemical group. One or more FILTERING variables can be selected from one or more of the FILTERING variable types. For example, a report could be filtered to include only Hazardous Air Pollutants (HAPs) reported by facilities in the NAICS 324 - Petroleum Sector in the State of California.
While most of the FILTERING variables are from submitted reporting forms, the following two groups contain data that comes from other EPA and non-EPA sources:
- The Chemical group contains sets of chemicals that correspond to chemical categories and designations (e.g., OSHA Carcinogens, and Hazardous Air Pollutants), and changes that have been made to the chemical list through the chemical petitions process and EPA-initiated review over the years.
- The Facility group contains flags for Federal facilities, facilities located within 100 km of the U.S.-Mexico Border, and facilities in an EJ area of concern.
My TRI Neighborhood
Additional filtering is available via My TRI Neighborhood. Use this feature to find what facilities are releasing toxic chemicals in your neighborhood, which chemicals are being released, and how much. You may also want to map the facilities to see where they are in your neighborhood. To use this filter, click the magnifying glass button ( ) to open the My Neighborhood box, enter an address, enter a distance around that address, and then click "Go" to geocode the address.
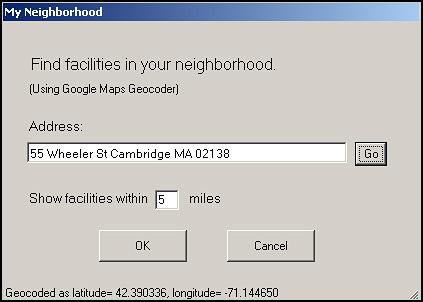
The tool uses the Google Maps Geocoder to assign latitude and longitude coordinates to your address. The assigned coordinates will appear in the bottom left corner of the My Neighborhood box. After you hit "Go," you can then click "OK" to accept these coordinates and limit all results to just those facilities within the specified radius of the location.
The filled background of the icon indicates the filter is on.
Clicking "Cancel" disables the filter. 
The My TRI Neighborhood filter can be toggled on and off by re-opening the My Neighborhood dialogue box and clicking "OK" or "Cancel."
This feature uses the Google Maps Geocoder to assign latitude and longitude coordinates to partial or complete addresses. For example, you can type a full address, just a city, or just a ZIP code in the address line of the My Neighborhood box to obtain locational coordinates. Note that entering a more complete address will result in more-accurate coordinates; providing only the street name and city, or only the city, or only a ZIP code will produce coordinates that correspond with the centroid of that street or area. Providing a complete address will help ensure that the correct coordinates are returned.
Note: You may also enter a Latitude, Longitude, and then click "Go" to make the geocoder use it.
| Address | Latitude | Longitude | Coordinate Accuracy |
|---|---|---|---|
| 55 Wheeler St, Cambridge MA 02138 | 42.3903 | -71.1447 | Best |
| Cambridge MA 02138 | 42.3753 | -71.1184 | |
| 02138 | 42.3800 | -71.1330 | |
| 42.38, -71.133 | 42.380000 | -71.133000 |