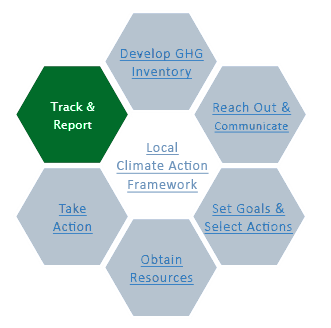
Track & Report
Tracking and reporting progress is an important part of public projects and programs. Tracking progress can help local entities assess program performance and success; identify specific areas for improvement or expansion; monitor local trends; and make informed decisions about future policies, goals, and actions. Public reporting can help generate interest in a project, promote accountability, improve project management, demonstrate progress, and attract political and financial support for the project.
Consider developing the plan to track and report early in the project, during the program design phase (see the Take Action phase for more information). Early planning allows the project team to establish a more complete understanding of the project’s intended impact and ensure that systems are in place to collect data throughout project implementation. If established early, tracking and reporting can be incorporated into the budget, schedule, and resource needs. However, it is never too late to establish a plan. Even if a program has been in place for many years, there are many benefits to tracking how things change.
The following key steps walk through developing, tracking, analyzing, and reporting on performance indicators. This simple approach shows how a combination of quantitative and qualitative indicators can be used to support a variety of programs. For detailed information about quantifying greenhouse gas (GHG) emissions, visit the Develop GHG Inventory phase.
Key Steps
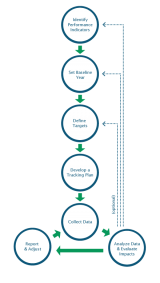
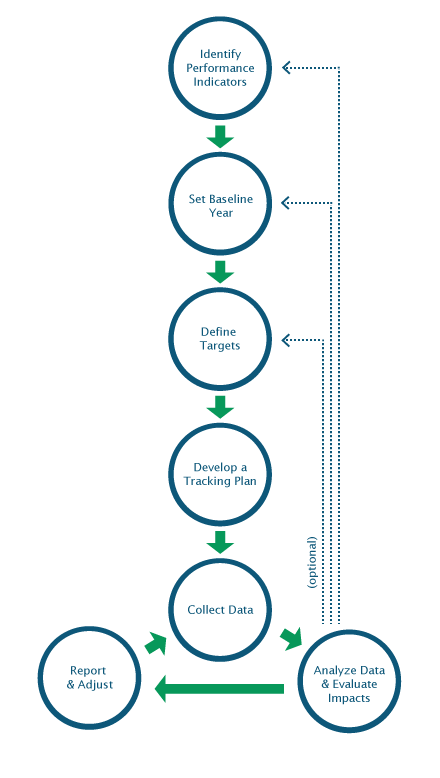
The exact process for tracking and reporting will vary by project and entity. This guidance outlines several key steps that are likely to be part of any tracking and reporting process. While each step is unique and important, some entities may find some steps are more relevant than others based on their situation. More importantly, the steps are not necessarily intended to be pursued in linear order, and they may require multiple iterations, as shown in the diagram. The final three steps in the process are a continuous loop, whereby progress is tracked, analyzed, and reported, and the project is adjusted; tracking and reporting progress is an ongoing and iterative process that provides continuous feedback to improve projects and programs.
- Step 1: Identify Performance Indicators
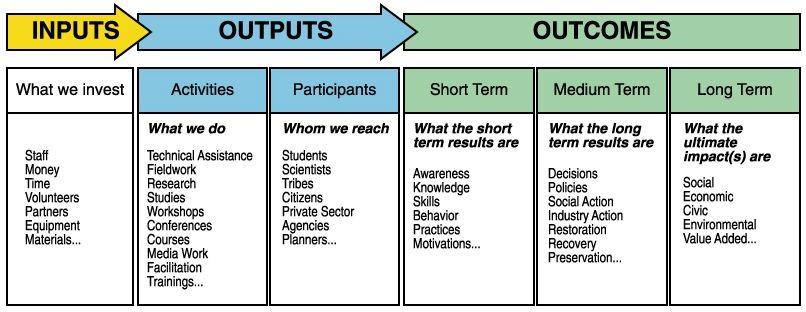
Performance indicators are measurable characteristics of a project that can be objectively evaluated over time. These may include inputs (e.g., staff time or money), outputs (e.g., the number of people reached or the number of workshops held), and outcomes (e.g., the increase in transit ridership or energy savings). Both quantitative and qualitative indicators are valuable to track. You may find that developing a logic model is helpful in organizing your thinking about performance indicators.
Logic Models
A logic model framing the project’s planned use of resources and desired ends in terms of inputs, outputs, and outcomes provides a useful foundation for developing the tracking and reporting plan for your project. Projects receiving federal funding may be required to provide a logic model and specifically report on inputs, outputs, and outcomes.Inputs are specific resources used to implement a program or project. Inputs might include funding, staff time, equipment, etc. Tracking inputs can help identify how and why the program is or is not able to meet its objectives.
Outputs or activities are the immediate products, actions, or results of the program or project. Outputs might include residential building retrofits, trainings given, or brochures disseminated. Tracking outputs can help to characterize what the program or project did.
Outcomes are the goals and objectives of the program or project. Outcomes might include energy savings, emissions reductions, or greater awareness and use of public transportation. Tracking outcomes can help demonstrate the program or project’s success in achieving its goals and objectives (see the Set Goals & Select Actions phase for more information about goal setting).
For detailed guidance on how to develop a logic model, visit EPA’s Online Logic Model Course.
Importantly, performance indicators measure progress toward overall program goals and objectives. Before identifying performance indicators, revisit the high-level project goals determined during the Set Goals & Select Actions phase. Revisit that phase to ensure your performance indicators, as well as your tracking and reporting efforts more generally, are clearly informed by what you are trying to accomplish with the project overall.
This step provides guidance on selecting specific performance indicators in line with the high-level, specific goals determined during the Set Goals & Select Actions phase. The step is divided into three sub-steps: brainstorm, assess, and select. This process encourages you to cast a wide net to consider some indicators that may be less obvious and conclude with a discrete list of indicators you can use to measure the success of your project.
As you brainstorm, assess, and select indicators, think about the narrative you hope to tell. Think about what metrics and data could strengthen the story and make it more compelling for the intended audience. Remember that indicators can be quantitative or qualitative and that they should support your overall project goals.
It may be helpful to engage select advisors in the process, as they can provide valuable input in determining how the project will be assessed; this can help project partners agree on how to measure project success. However, keep in mind that engaging stakeholders is often more helpful at the goal-setting stage than at indicator-selection and target-selection stages, as stakeholders may have unrealistic ideas about what constitutes good targets and indicators. See the Reach Out & Communicate phase for more information on engaging stakeholders.
Brainstorm
Start with a brainstorming session to develop a comprehensive and creative list of potential indicators. Before you brainstorm, review the project goals (you may want to have a list of the goals handy while you brainstorm)—all tracking and reporting activities will relate to the project goals. At the same time, remember this is a brainstorming session—be inclusive. Avoid eliminating or looking for challenges related to any of the potential indicators, which will be done during the assessment process. For emissions reduction efforts, consider indicators related to both emissions reduction and the activities producing those emissions. For example, you might track both increases in recycling activities and the resulting emissions reductions. Consider both the overall goal of the project (as determined in the Set Goals & Select Actions phase) and what types of information would be useful in determining if the project is successful.The following list provides some example indicators for projects to increase community sustainability. The list is not exhaustive and many of the indicators may not fit across a range of projects.
- Number of people who participated (e.g., in bike-to-work campaign, who completed residential solar panel installation projects, attendees at an event)
- Amount of waste being diverted from the landfill through recycling and composting programs
- Percent of residents who walk or use transit
- Number of presentations or trainings conducted
- Improved scores or ratings of knowledge from a presentation or training
- Number of people familiar with a program or concept
- Attitudes toward recycling
- Number of urban trees planted
- Greenhouse gas emissions
- Success in passing legislation
- Number of energy efficient light bulbs distributed
- Aggregate water use or energy use in a region
- Square footage, number, or percentage of green roofs or cools roofs installed
Assess
Now that you have a broad list of indicators, determine which indicators are valuable and feasible to measure. There are three essential qualities for selecting a good set of indicators. Good indicators are: (1) relevant, (2) measurable, and (3) accessible.- Relevant: Is the indicator useful in determining if the project goals are being met? Is it programmatically important? Is it relevant to the audiences you will be sharing your results with? If the indicator does not contribute to understanding the success of meeting project goals, it is not a good allocation of resources. Avoid measuring for the sake of measuring.
- Measurable: Is it possible to track progress? If the indicator is qualitative, is it possible to rank the evaluation (e.g., high/medium/low or excellent/good/satisfactory/needs improvement) so improvements can be tracked? Does it provide an accurate measure of a task? Can it be defined in clear terms? Will it be consistently measured the same way by different observers?
- Accessible: Is the project team able to obtain the necessary data for this indicator at intervals appropriate for the project goals? Barriers to accessibility may include data privacy, inadequate resources to collect the data (e.g., staff time, technology), or highly aggregated data that reduces usefulness.
The following table provides an example matrix that evaluates these qualities for sample performance indicators identified during a hypothetical brainstorming session of a program designed to increase the use of public transit and decrease trips in single-occupancy vehicles. The table is not exhaustive, and it is intended for illustrative purposes only.
Indicator
Relevant
Measurable
Accessible
Include
Public awareness of transportation options
Yes – one of the project goals is to increase the accessibility of alternate modes of transportation
Yes – qualitative measurement that can be surveyed
Yes – the project could develop a survey to ask residents about their awareness of transportation options
Maybe – the metric is relevant, measurable, and accessible. Consider inclusion.
Ridership – number of bus rides per day originating in a specific neighborhood
Yes – the change in the number of bus rides is one of the project goals
Yes – riders pay a fare when they board the bus, it is possible to count the number of rides
Maybe – the department of transportation currently only collects data on the number of rides per bus per day, but they are in the process of exploring bus-stop data collection opportunities
Maybe – if there is an easy method for accessing the data. Contact the bus operating agency to see if it is possible to access or deduce this information.
Vehicle miles traveled in private vehicles
Yes – one of the project goals is to decrease car trips
Maybe – this is a frequently used metric, but it is difficult to measure on the neighborhood level
No – collecting this data within the specific neighborhood would be overly burdensome for this project
No – without an easy way to access the data, this is not a feasible metric for this project
Select
Once you identify a set of viable (relevant, measurable, and accessible) performance indicators, the next step is to select the list of indicators that best fit the project. Consider the story you want to tell with your indicators; select a set of indicators that narrate a story of success or precisely guide the implementing body to adjust the program to optimize future success.Develop a final list of indicators that is sufficient and succinct. Too few indicators will provide the project team with limited information. Too many indicators will be burdensome and deter regular tracking and reporting. Be realistic about what your project can support related to tracking and reporting; it is better to track fewer indicators consistently than to set an unrealistic tracking plan and end up with inconsistent or incomplete sets of data.
Consider the following questions in selecting the set of indicators:
- Will it be helpful in attracting support from the community, decision-makers, and potential funders?
- Does the set of indicators cover each component of the program? If the program covers multiple sectors, like a high-level climate action plan or sustainability plan, consider grouping indicators into sectors such as: transportation and land use, building energy use, waste and recycling, community outreach, and adaptation and resilience. A more focused energy efficiency building retrofit incentive program might be grouped into the following areas: residential, commercial and industrial buildings, and institutional and public buildings.
- Does each indicator have a measurable value or benefit to the target audiences? Remember to think creatively about “measuring” qualitative indicators.
- Will these indicators highlight specific adjustments that can improve the project?
- Does the set of indicators measure something directly or significantly influenced by the project?
- Are changes in the indicator attributable to the project? While it is very rare to be able to completely and directly attribute a change in an indicator to a program, it is important to consider other factors capable of affecting the indicator. Choose indicators that are not heavily influenced by external factors and acknowledge important external factors during the analysis.
- Is this the best available set of indicators or is there another set of more relevant, specific, or accessible indicators capable of providing similar information?
For more information about selecting indicators, see EPA’s Sustainability Analytics compendium, which provides detailed information and guidance on science-based assessment tools and approaches available to support sustainable decisions.
- Step 2: Set Baseline Year
The baseline year will be the basis of comparison for the project. Success will be measured by the difference from the baseline year.
Consider the following factors when selecting a baseline year:
- Is there a significant year that would be logical for the baseline year, such as the start of a program or a political change (e.g., mayoral election or legislation)? If possible, select a baseline year that correlates with goals, commitments, or another significant change.
- Are data available for that year? Keep in mind you may only be able to confirm your baseline year selection after you begin to collect data and confirm data are available.
- Is the year “typical” for your community (e.g., no unusual weather or economic conditions)?
As an example, the West Chester Area School District in Pennsylvania selected a baseline year of 2008 because the Student Conservation Corps program started in 2009 and they wanted to compare program implementation years to the pre-implementation year.
- Step 3: Define Targets
One of the main purposes of tracking and reporting indicators is to measure the success of the program. To measure success, first define what success looks like for the project. You can use targets for indicators to collectively demonstrate the success your community wants to achieve.
You may have already established specific project goals that serve as high-level targets, as part of your efforts during the Set Goals & Select Actions phase. For example, one project may have the goal of installing solar panels on 30 commercial buildings; another project may have the goal of increasing the rate of solar panel installation on commercial buildings by 50 percent over the number of installations during the baseline year; and a third project may have a goal of decreasing greenhouse gas emissions by 50 percent from the baseline year through solar panel installation.
Revisit the project goals and establish more specific targets that reflect your selected indicators and align with the overall project goals. For example, you might set targets of holding three workshops on solar options and reaching 75 businesses through workshops or industry events. If your project goal has a long time horizon (e.g., decreasing GHG emissions by 2050), consider setting incremental targets that will demonstrate progress. Targets set in this step will likely represent short-term, incremental, or smaller-scale targets to help keep the project on track to achieve the long-term target.
As noted in the Set Goals & Select Actions phase, consider the following questions when setting targets:
- What regulations, if any, should you consider in setting the target?
- What is the long-term target of the project and when will it be achieved?
- What short-term targets would keep the project on track to achieve the long-term target?
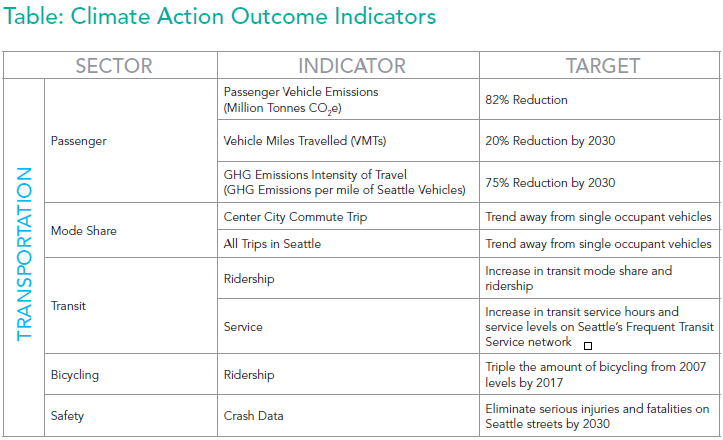
As an example, the City of Seattle Climate Action Plan (96 pp, 11 M, About PDF) Exit has an extensive list of indicators, each with an associated target; see the table below for an example of the targets associated with each indicator. Note that the indicators are used to measure the success of various sectors (performance areas).
Consider historical data when setting targets, to ensure targets are realistic. Ideally, it is best to have at least two years of historical data on which to base your targets.
Although it is helpful to have targets for each indicator; it may be valuable to track indicators that do not have specific targets associated with them to understand trends that help tell a good story. For example, the City of Berkeley has a car share indicator (1 pp, 65.3 K, About PDF) Exit that does not have a target, but helps the city understand trends in vehicle miles travelled and associated greenhouse gas emissions. It is not necessary to have a target for every selected indicator.
- Step 4: Develop a Tracking Plan
Now that you have identified indicators, develop an efficient, consistent, and reliable process for data collection and management. Below are some considerations for developing a data collection protocol. Allocate resources (e.g., staff, time) to the following activities.
- Determine who will be responsible for collecting data for each indicator. Identify a single tracking manager who will compile the data, once collected. The tracking manager may also be responsible for ensuring all data security measures are met.
- Maintain the highest degree of individualized data as possible without compromising security and privacy (it is easier to aggregate data in the future). Remove all personally identifiable information (e.g., names, addresses, phone numbers, date of birth) when conducting analysis and reporting results. If you need unit-specific information (e.g., household or person), assign each unit an ID that is correlated, but not directly connected to personally identifiable information. Keep data on a secure computer or server. Use password protection and limit access to avoid the misuse of data.
- For each indicator, determine if you can integrate data collection into an existing process or standard operating procedure. For instance, if the accounting department records the amount of money spent on electricity in government buildings each month, can the process be expanded to record the kilowatts consumed each month?
- Consider using an existing tracking program or template, such as the ENERGY STAR® Portfolio Manager, to compile and organize data. If it is not possible to integrate tracking into an existing system or template, develop a database or spreadsheet to easily track the indicators. Talk to the people and entities who will provide data (e.g., utilities, transportation department, water facility manager) to understand what information they have available and in what form it can be provided. Develop a system and template to accommodate the available data.
- Minimize the burden of data requests and make it easier for someone to give you the necessary information. It can be helpful to develop and provide a template for people to populate (such as a spreadsheet with labeled rows and columns) to ensure you get the required data. However, be prepared to take data in its raw form and enter it into your template/system yourself.
- If data are not currently available for a particular metric or are limited in their reliability, establish a reminder to begin collection in the future, if possible.
- Carefully document all data sources, including points of contact for collecting the data. This will help you remember what you did when you return to the data later; allow you to provide credible documentation if requested from stakeholders; and make it easier for you or others to collect data over time to measure your progress.
- Keep track of all units and plan to follow up if the units are not clear in a dataset. Include a unit conversion sheet for those who are entering the data for you (e.g., for energy data you would likely use Therms to Btus, CCF to Btus, kWh to Btus).
- Consider what data may be helpful in the future. Collect related data if they are readily available, even if you are not sure yet how they may be used.
- Explore novel approaches for gathering data. For example, crowdsourcing data (collecting data from volunteer reporters) through an online portal or smart phone application can produce large amounts of data that would not necessarily be readily available. For example, for a program to promote alternate transportation options, you might start a website where participants can log how many bus trips, bike trips, or walks replaced car trips. The Utah Department of Transportation developed TravelWiseExit to help individuals, businesses, and organizations use and record the use of alternatives to driving alone.
- Set a schedule for data collection and analysis of each metric. Adjust the schedule to reflect the indicators. If you assess energy use on a monthly basis, monthly data collection may be appropriate. However, avoid expending extra effort by only collecting data as often as is useful. For example, some data may be available both monthly and annually, but annual data suffice for tracking progress. Determine how often you will evaluate and report the results of the program. Evaluation typically occurs at fixed intervals (e.g., mid-point of the program or annually), even when tracking is carried out on a continuous basis. Keep in mind a program may select ongoing measurements of several indicators and a periodic snapshot that is more comprehensive. In these cases, the scope of data collection for the baseline year and the periodic snapshots may exceed the scope of the regular data collection.
- Consult resources that provide more specific information about how to track indicators related to your program. See the resources in the box below for detailed information on establishing a baseline and tracking progress related to several issues.
Resources for Tracking and Reporting
Greenhouse Gas Emissions- See the Develop GHG Inventory phase.
- Local Government Operations Protocol for GHG Assessments – Provides guidance on calculation methodologies, emission factors, and other aspects of inventory development for local government assets and operations. Developed in partnership by the California Air Resources Board, the California Climate Action Registry, ICLEI-Local Governments for Sustainability, and The Climate Registry.
- ICLEI’s U.S. Community Protocol for Accounting and Reporting of Greenhouse Gas EmissionsExit – Provides guidance on calculation methodologies, emission factors, and other aspects of community-wide inventory development.
- EPA’s AirData – Compiles data from EPA’s Air Quality System monitors around the country, providing air quality statistics, pollutant concentration maps, and other tools.
- EPA’s Emission Inventory Improvement Program – Provides protocols and methodologies for completing a criteria air pollutant emissions inventory.
- EPA’s Assessing the Multiple Benefits of Clean Energy, Section 4.2.1 – Describes steps for developing and projecting a baseline emissions profile, including GHGs and criteria air pollutants. This resource is directed primarily at states, but has information that can be applicable for local governments.
- Your state air agency’s criteria air pollutant inventory – Typically created every three years as part of requirements under the National Ambient Air Quality Standards (NAAQS).
- EPA’s WaterSense at Work: Best Management Practices for Commercial and Institutional Facilities – Provides guidance on assessing facility water use.
- ENERGY STAR guidance on benchmarking energy use for facilities – Provides information and tools on measuring building performance, including Portfolio Manager.
- Carnegie Mellon University’s Economic Input-Output Life Cycle AssessmentExit – Estimates the relative impacts of different types of products and materials throughout the supply chain.
- GHG Protocol’s Corporate Value Chain (Scope 3) Accounting and Reporting StandardExit– Provides a protocol for companies to estimate GHG emissions associated with their value chains. Can be informative for local governments evaluating impacts of purchasing decisions.
- EPA's Recycled Content (ReCon) Tool – Evaluates the GHG benefits associated with increasing the recycled content of purchased materials.
- Greenhouse Gas Emissions Associated with Purchasing of Goods and Services by the City of Eugene, Oregon (18 pp, 471 K, About PDF) Exit – Provides an example of how one city estimated these emissions.
- U.S. Bureau of Labor Statistics’ Approach for Measuring Green JobsExit – Provides examples of what qualifies as a “green” job.
- Your local chamber of commerce or similar organization – May have information about employment by industry.
Complete these first five steps prior to collecting data. It may be necessary and advantageous to revisit these steps periodically. As your program is implemented, it may be appropriate to add or adjust goals, update the indicators to reflect newly available data, and/or make targets more ambitious to keep pace with new technology and program advances. It is also good to be aware of desired datasets—a wish list of datasets—that may not exist in the initial stages, but that might become available down the road.
- Step 5: Collect Data
Once you have established tracking procedures and selected the baseline year, begin collecting data. Start by collecting data for the baseline year and then commence regular data collection based on the established tracking plan. This step is the first in a process that will be continually repeated.
- Step 6: Analyze Data and Evaluate Impacts
You can gain valuable lessons by analyzing data about your project at regular intervals. Draw big-picture lessons from the results to understand elements of your program that have been particularly successful or have room for improvement. Ask questions such as:
- How much progress has been made between the baseline data and the post-implementation data?
- Are the results on track for achieving intermediary and long-term targets?
- What other factors or programs could have influenced the change between the baseline and post-implementation year? Since it is difficult or impossible to hold other variables constant, be sure to consider possible external influences in the analysis and mention them in reporting.
- Do the data support the narrative developed in Step 1? Why or why not?
Document the process and all assumptions so the analysis can be replicated in future years. Record the data analysis in a format that can be used in Step 7.
Revisit Steps 1, 3, and 4, as needed. Determine if adjustments to the narrative or targets are necessary (were they unrealistic?) or if adjustments to the measurements are appropriate (were they measuring the wrong thing?). Be prepared to justify any changes to either the narrative or the indicators. Make such adjustments with caution; while it may be wise to refine and improve the measurements, it is not advised to rewrite or redefine the goals and targets completely because this may detract from the initial project goals and the validity of the assessment. If indicators are added, collect measurements for a baseline year (in some cases it will be necessary to define a new baseline year for a new measurement if the data for the original baseline year are not available).
- Step 7: Report and Adjust
The results of data analysis can be used in two primary ways: to report findings and to adjust actions.
Reporting findings can be an effective way to solicit public, political, and financial support for the program. Consider the following questions as you establish a useful approach to reporting results:
- Who is the target audience for the report? It may be decision-makers who will vote on related legislation or technical experts who will assess how to design subsequent projects. Include the indicators you identified for this audience in Step 1.
- Who is the target audience for outreach? Is it different from the report? It may include the general public, who can be complimented for participation or encouraged to engage in the ongoing project. Again, include the appropriate indicators, as identified in Step 1.
- Should you make one or several reports available? For example, this might include a high-level executive summary and a detailed assessment, depending on the target audience.
- What method or methods are appropriate to reach the target audience? Use a variety of methods that can effectively reach the intended audience. Methods may include social media, local news outlets, bus posters, and phone calls to city council members, among others.
- How can you frame the information to best reach the target audience? For example, a simple set of graphics alone might do the trick for a large group of stakeholders, but a detailed report might be more effective for a group of technical experts. Reports might be produced in a printed format as was done for Philadelphia’s GreenworksExit, or they might be made available online in a more interactive fashion as was done by San Jose’s Green VisionExit.
- How should you schedule updates to the reported information? For example, reports may only need to be updated every few years with new information, but websites and articles may need to be updated more frequently.
- Can you use the data for any relevant budget or strategic planning processes?
Visit the Reach Out & Communicate phase for more detailed information about engaging stakeholders and communicating findings. Visit the Local Examples page for examples of implementation progress reports.
In addition to gaining project support, indicators can be used to identify the strengths, weaknesses, and opportunities in a program. Use the detailed information to identify areas that can be improved or parts of the project that would be valuable to replicate. Consider the following questions:
- What parts of the program were most successful? What contributed to the success?
- What parts of the program were least successful? What detracted from the success (e.g., inadequate staff time or resources)?
- How can the actions be improved?
- Can you replicate or adjust elements of one successful action to improve the success of another?
Based on the answers to these questions, adjust program activities and continue to track results to see the impact of the adjustments.
Remember tracking and reporting is an ongoing process. Once you have assessed the data, reported the findings, and adjusted project actions accordingly, continue collecting data and repeat the process. Repeat the final three steps of this process throughout the duration of the reporting period, which will ideally last at least as long as the project duration.
Case Studies
Philadelphia, Pennsylvania: Greenworks PhiladelphiaExit
An ambitious plan, with accompanying progress reports, that sets 15 sustainability targets in the areas of energy, environment, equity, economy, and engagement.
Seattle, Washington: The Seattle EcoDistrict (138 pp, 15.5 M, About PDF) Exit
An example of how to develop, measure, and report indicators in a way that is visually appealing and easily accessible to the public and decision-makers.
San Jose, California: Green Vision GoalsExit
A website that demonstrates how San Jose is publicly communicating progress toward 10 discrete goals related to its sustainable community plan.
Southern Tier, New York: Cleaner Greener Southern Tier (187 pp, 6.17 M, About PDF) Exit
A sustainability plan that spans eight counties in New York State and identifies 18 indicators to measure progress in nine performance areas. Call-out boxes highlight the 2010 baseline and 5-year and 20-year targets.
Massachusetts: GreenDOT Implementation Plan (71 pp, 954 K, About PDF) Exit
A plan to achieve the Massachusetts Department of Transportation stewardship goal that outlines sustainability initiatives, goals, tasks, indicators, implementation time horizons, and responsible divisions.
Tools and Templates
Argonne National Laboratory Alternative Fuel Life-Cycle Environmental and Economic Transportation (AFLEET) ToolExit
A tool that examines the environmental and economic costs and benefits of alternative fuel and advanced vehicles.
ENERGY STAR® Portfolio Manager
An online tool to measure and track energy and water consumption, as well as greenhouse gas emissions.
EPA's Waste Reduction Model
A tool that helps solid waste planners and organizations track and voluntarily report GHG emissions reductions from several different waste management practices.
State and Local Transportation Calculators and Monitoring Tools
An EPA website that links to several modeling tools including the MOVES Model, NONROAD Model, Airport Ground Support Equipment Model, Business Benefits Calculator, SmartWay FLEET Performance Model, Diesel Emissions Quantifier, and School Bus Calculator.
Sustainable Community Indicator CatalogExit
A Partnership for Sustainable Communities’ Web-based catalog that helps communities identify indicators that can measure progress toward their sustainability objectives.
Further Reading
EPA’s Tracking, Evaluating, and Reporting LBE Program Progress
A chapter from the EPA Lead by Example (LBE) guide that provides information on how to track, evaluate, and report the performance of LBE programs and projects.
EPA’s Emissions Inventory Improvement Program
Reports that provide protocols and methodologies for completing a criteria air pollutant emissions inventory.
EPA’s WaterSense at Work: Best Management Practices for Commercial and Institutional Facilities
Guidance on assessing facility water use.
EPA’s Climate Showcase Communities Local Climate and Energy Program Model Design Guide
A guide that includes a section on evaluating and evolving your program model and an Appendix on performance indicators.
U.S. Bureau of Labor Statistics' Green Jobs OverviewExit
A website that describes the bureau’s approach to measuring green jobs.
Acknowledgements:
EPA would like to acknowledge Arturo Blanco (Houston Bureau of Air Quality Control, Texas); Lisa Lin (City of Houston Mayor’s Office of Sustainability, Texas); Seth Stark (WSDOT, Washington); Timothy Burroughs (City of Berkeley Office of Energy & Sustainable Development, California); Frank Cunningham (City of Columbia, Missouri); and Maria Sanders (City of El Cerrito, California) for their valuable input and feedback as stakeholder reviewers for this page.