Local Examples of Climate Action
 Across the country, local governments—including cities, counties, tribes, and regions—are taking action to address climate change. This action takes many forms, but it commonly includes developing a greenhouse gas inventory to understand sources of emissions, followed by creating a climate change action plan to reduce greenhouse gas emissions and prepare for climate change impacts. The next step is to implement the plan’s actions, providing updates on progress and revising the plan as needed.
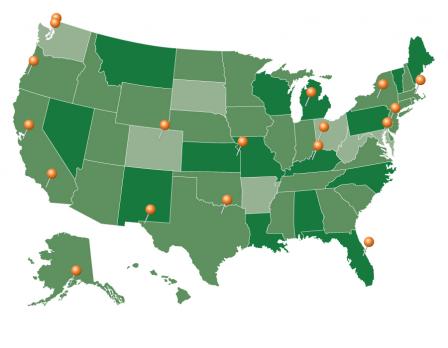
This page provides a diverse range of models for climate action planning. These examples represent communities across the country of various sizes and jurisdictions. Some plans focus on government operations while others address community-wide emissions and impacts. While all of the plans focus on climate change mitigation (reducing greenhouse gas emissions), many of them also include climate change adaptation (preparing for and responding to the impacts of climate change).
| Government | State | Pop. | Plan Scope | Includes Adaptation? | Mult. Juris-dictions? | Reasons to Learn More About This Example |
|---|---|---|---|---|---|---|
| City of Boston | MA | 646,000 | Community-wide | Yes | No | • Regularly updates plan • Expanded plan to include community-wide actions and climate preparedness strategies |
| Tompkins County | NY | 104,000 | Community-wide | Yes | Yes | • Pursuing multiple initiatives and plans to achieve target • Participating in broader regional sustainability plan • Received EPA Climate Showcase Communities Grant |
| City of Baltimore | MD | 620,000 | Community-wide | Yes | No | • Annually updates plan • Identified most cost-effective mitigation strategies • Received EPA Climate Showcase Communities Grant |
| City of Philadelphia | PA | 1,553,000 | Community-wide | Yes | No | • Releases annual progress reports • Uses ENERGY STAR Portfolio Manager • Analyzed recent and future climate |
| City of Louisville | KY | 253,000 | Community-wide | Yes | No | • Includes focus on city-wide adaptation and resilience • Draws on inventory efforts conducted with local partners |
| Southeast Florida Regional Climate Change Compact Partner Counties | FL | 560,000 | Community-wide | Yes | Yes | • Coordinates climate action across four counties |
| City of Grand Rapids | MI | 190,000 | Government | Yes | No | • Produces annual progress reports • Already achieved GHG reduction target for 2012 • Released community-wide plan on resilience |
| City of Cincinnati | OH | 300,000 | Community-wide | Yes | No | • Has updated plan • Received EPA Climate Showcase Communities Grant |
| City of El Paso | TX | 674,000 | Community-wide | No | No | • Releases annual Sustainability Report Cards |
| City of Dallas | TX | 1,258,000 | Community-wide | No | No | • Has updated plan • Demonstrated reduction of emissions from government operations |
| City of Mission | KS | 9,000 | Community-wide | No | No | • Developed multiple plans, including scorecard to evaluate progress • Identified separate approaches for government operations and broader community • Meets monthly to discuss plan |
| Boulder County | CO | 310,000 | Community-wide | Yes | Yes | • Adopted by all cities and towns in the county • Established carbon neutrality target for internal operations |
| Cities of Albany, El Cerrito, Piedmont, and San Pablo | CA | Albany: 17,000 El Cerrito: 24,000 Piedmont: 11,000 San Pablo: 30,000 |
Community-wide | Yes | No | • Collaborated to develop individual plans • Received EPA Climate Showcase Communities Grant |
| City of Los Angeles | CA | 3,880,000 | Government | No | No | • Developed detailed information about implementation • Releases annual government and community-wide GHG inventories |
| City of Homer | AK | 5,000 | Community-wide | Yes | No | • Represents first CAP in the state • Released implementation report • Includes revolving energy fund |
| City of Eugene | OR | 159,000 | Community-wide | Yes | No | • Has released progress reports • Includes adaptation strategies for health and social services, urban natural resources • Received EPA Climate Showcase Communities Grant |
| City of Seattle | WA | 652,000 | Government | Yes | No | • Established carbon neutrality target for government operations • Created short-term implementation goals • Received EPA Climate Showcase Communities Grant • Produced multiple city-wide and municipal GHG inventories |
| Swinomish Indian Tribal Community | WA | 3,000 | Community-wide | Yes | No | • Focused on tribal adaptation • Includes mitigation |
City of Albany’s Population: 17,000
City of El Cerrito’s Population: 24,000
City of Piedmont’s Population: 11,000
City of San Pablo’s Population: 30,000
The cities of Albany, El Cerrito, Piedmont, and San Pablo worked collaboratively to develop their individual community-wide Climate Action Plans through the EPA Climate Showcase Communities program. The partnership helped facilitate information sharing and streamlined their separate planning processes. The cities each developed greenhouse gas inventories, adopted emission reduction targets, and held community workshops to identify mitigation strategies.
The following links exit the site Exit
Link to Albany’s Climate Action Plan, El Cerrito’s Climate Action Plan, Piedmont’s Climate Action Plan (PDF) (160pp, 6.18M, About PDF), and San Pablo’s Climate Action Plan.
Baltimore, MD
City Population: 620,000
In 2008, the City of Baltimore released a baseline government and community emissions inventory, as well as a Sustainability Plan. The Sustainability Plan established a community-wide greenhouse gas emissions reduction goal of 15% by 2015 and the city developed a Climate Action Plan in 2012 to identify the most cost-effective mitigation strategies to meet the target. Through the EPA Climate Showcase Communities Program, Baltimore engaged with non-profit organizations to help reduce electricity use and emissions. Additionally, Baltimore is working on climate adaptation and approved a Disaster Preparedness Project and Plan in 2013. The Sustainability Plan is updated annually and, going forward, will report on the implementation status of the disaster preparedness plan.
The following links exit the site Exit
Links to Baltimore’s Inventory (PDF) (16pp, 282K, About PDF), Sustainability Plan, Climate Action Plan, and Disaster Preparedness Project and Plan.
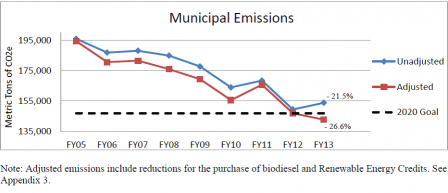 Boston’s municipal emissions for FY05-FY13Boston, MA
City Population: 646,000
Boston’s original Climate Action Plan was released in 2007 and is updated every three years based on recommendations from advisory committees and public input. The first plan established greenhouse gas emissions reduction goals of 25% by 2020 and 80% by 2050 for government operations and the subsequent update adopted the same emissions reduction targets for the community. Additional updates have included climate preparedness strategies and encouragement for community involvement in the City’s “Greenovate Boston” program, which is a sustainability initiative to help support climate action in the City’s neighborhoods. The City also releases annual updates to its municipal greenhouse gas inventory.
County Population: 310,000
Boulder County’s comprehensive sustainability plan was developed through multiple stages. A county-wide greenhouse gas inventory served as the basis for a Greenhouse Gas Mitigation Report released in 2007, which identified opportunities to reduce emissions. In 2008, all cities and towns in Boulder County adopted the Sustainable Energy Plan, which outlines 35 total recommended actions to reduce emissions from the energy sector. In 2012, the county developed a Climate Change Preparedness Plan, which focuses on opportunities for resilience. Finally, the Environmental Sustainability Plan established a county-wide greenhouse gas reduction target of 40% by 2020 from a 2005 baseline and a carbon neutrality target for internal county operations by 2020.
The following links exit the site Exit
Link to Boulder County’s Greenhouse Gas Mitigation Report (PDF) (20pp, 381K, About PDF), Greenhouse Gas Inventory (PDF) (172pp, 5.86M, About PDF), Sustainable Energy Plan, Climate Change Preparedness Plan (PDF) (159pp, 1.02M, About PDF), Environmental Sustainability Plan
City Population: 300,000
The Green Cincinnati Plan, originally adopted in 2008, established a community-wide greenhouse gas reduction target of 84% by 2050 and recommended over 80 specific actions to reduce emissions. The city promoted the plan through media, partnerships, and community events through the EPA Climate Showcase Communities program and in partnership with the region’s sustainability alliance. Cincinnati has also released a five-year update of the plan, which includes implementation matrices for each sector and new chapters on water, outdoor recreation, and adaptation initiatives.
City Population: 1,258,000
The City of Dallas’ Sustainability Plan was released in 2012 and updated in 2014. The plan outlines objectives, strategies, and targets for climate mitigation efforts for the government and broader community across a range of sectors. Dallas also completed municipal and community-wide greenhouse gas inventories for both 2005 and 2010. The most recent inventory indicated a 33% reduction of emissions from government operations from 1990 levels, driven by the purchase of renewable energy sources for government consumption and energy efficiency improvements in the power generation sector.
The following links exit the site Exit
Links to Dallas’ Greenhouse Gas Inventory (PDF) (12pp, 397K, About PDF)and Sustainability Plan
 Solar panels in El PasoEl Paso, TX
City Population: 1,258,000
In 2009, the City of El Paso released its Sustainability Plan, which includes community-wide goals for climate and clean energy action. The city has since published annual Sustainability Report Cards to track progress of climate mitigation activities across sectors, including buildings, energy, transportation, and waste. In addition, the city completed a baseline government greenhouse gas inventory for 2009 and will update the inventory when 2013 data become available.

City Population: 159,000
The City of Eugene’s Community Climate and Energy Action Plan established goals to reduce community-wide greenhouse gas emissions 75% below 1990 levels by 2050, and community-wide fossil fuel use 50% by 2030. Under EPA’s Climate Showcase Communities Program, Eugene developed an outreach program to reduce the number of drive-alone car trips and transportation emissions. Additionally, the plan includes chapters that specifically lay out climate adaptation strategies for health and social services, and urban natural resources. The city released Progress Reports in 2011 and 2013 and community and municipal greenhouse gas inventories are available.
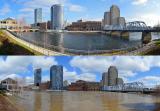
City Population: 190,000
The City of Grand Rapids produces annual progress reports on the implementation of its Sustainability Plan (FY2011-FY2015). The city has met its commitment to a greenhouse gas emissions target for government operations of 7% below 1990 levels by 2012 under the U.S. Conference of Mayors Climate Protection Agreement, and is continuing to reduce emissions at the target rate of 1% per year. Additionally, Grand Rapids released a community-wide Resiliency Report in 2013, which features an analysis of future climate and recommendations for adaptation action across a range of sectors. A baseline government and community greenhouse gas inventory is also available.
Link to Grand Rapid’s Sustainability Plans and Reports page Exit
City Population: 5,000
In 2007, the City of Homer released their community-wide Climate Action Plan, the first CAP in Alaska. The CAP included government and community-wide greenhouse gas inventories, established the greenhouse gas reduction target of 20% by 2020 from a 2000 baseline, and identified mitigation and adaptation strategies. The city released an Implementation Report in 2010, which builds on the actions identified in the CAP. As part of their efforts, the city has implemented unique initiatives, including the establishment of a revolving energy fund to reduce energy use in municipal buildings and the development of a guidebook for City employees to reduce energy use and waste in local government operations. Recommendations for adaptation include promoting local agriculture to support a resilient local economy and considering climate change in all long-range planning efforts.
Link to Homer’s Climate Action Plan and Implementation Report Exit
City Population: 3,880,000
Los Angeles’ Climate Action Plan, GreenLA, was released in 2007 and established the community-wide greenhouse gas emissions reduction goal of 35% below 1990 levels by 2030. The plan identifies 50 emission reduction action items across various focus areas, with a focus on reducing emissions from the city government. The city also developed ClimateLA, a living document that provides detailed information about implementation of each action item in GreenLA. Annual greenhouse gas inventories at both the municipal and community level are developed to track the city’s progress. The plan will be updated to include adaptation actions.
The following links exit the site Exit
Link to Los Angeles’ GreenLA (PDF) (29pp, 132K, About PDF) and ClimateLA (PDF) (151pp, 653K,) About PDF)
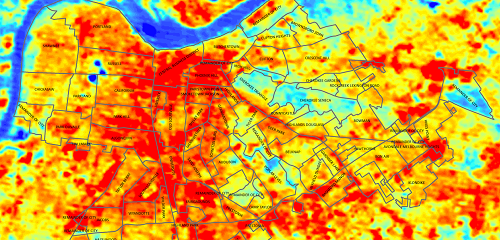 Louisville surface temperatures by neighborhoodsLouisville, KY
City Population: 253,000
The Louisville Metro Government released Sustain Louisville in 2013. The sustainability plan establishes multiple community-wide climate mitigation goals, including a transportation sector emissions reduction target of 20% by 2020. Sustain Louisville also includes a focus on city-wide adaptation and resilience, including the development of a comprehensive urban heat island assessment and heat management plan. Before the release of Sustain Louisville, the city government worked with local partners to develop the Partnership for a Green City’s Climate Action Report and greenhouse gas inventory.
The following links exit the site Exit
Links to Sustain Louisville and Climate Action page
City Population: 9,000
By 2012, the City of Mission, Kansas had created a Climate Action Plan (CAP), a Sustainability Program and Initiatives Plan, and a scorecard to evaluate Mission’s progress towards the plans’ goals to improve the environment, community, and economy. The city’s CAP established a target greenhouse gas reduction goal of 20% by 2020 for government operations and the broader community and includes separate sections with recommendations for both. The city’s Sustainability Commission meets monthly to discuss progress and future action items. Baseline city-wide and government greenhouse gas inventories are also available.
Link to Mission’s Sustainability Commission and Documentation Exit
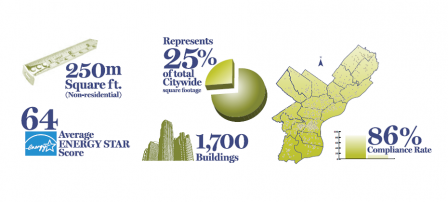 Results from Philadelphia’s 2014 building energy benchmarking reportPhiladelphia, PA
City Population: 1,553,000
The City of Philadelphia’s Greenworks Philadelphia initiative includes both climate mitigation and adaptation targets, including a city-wide greenhouse gas reduction goal of 20% by 2015. Greenworks was updated in 2012 and annual Progress Reports provide updates on the 160 included initiatives, as well as new efforts, such as an analysis of recent and future climate. Philadelphia’s government and city-wide greenhouse gas inventories are also frequently updated. To help lower energy consumption, the City utilizes the ENERGY STAR Portfolio Manager and released the latest building energy benchmarking report in 2014.
Link to Philadelphia’s Mayor’s Office of Sustainability Exit
City Population: 652,000
The Seattle Climate Action Plan was adopted in 2013 and established a target of carbon neutrality of government operations by 2050. The CAP focuses on emissions reduction through government action in the sectors of road transportation and land use, building energy, and waste, and also includes adaptation actions. The CAP was based on the work and recommendations of the City’s appointed advisory groups, as well as public input. Shortly after the release of the CAP, the city released an Implementation Strategy, designed to put Seattle’s plans into motion by creating short-term implementation goals to be implemented by 2015. The City also used an EPA Climate Showcase Communities grant to implement a high-performance building district in downtown Seattle to reduce energy and water use and emissions. City-wide and municipal greenhouse gas inventories across multiple years are also available.
The following links exit the site Exit
Link to Seattle Climate Action Plan (PDF) (86pp, 11.0M, About PDF) and Implementation Strategy (PDF) (74pp, 1.2M, About PDF)
Regional Population: 560,000
The Southeast Florida Regional Climate Change Compact developed a regional Climate Action Plan for Palm Beach, Broward, Miami-Dade, and Monroe Counties in 2012. The Compact was established to coordinate community-wide climate action across county lines and the plan establishes the region’s climate mitigation and adaptation goals and actions. The plan’s supporting documents include an implementation guide, a regional baseline greenhouse gas emissions inventory by county and sector, a unified sea level rise projection for the region, and an analysis of vulnerability to sea level rise.
The following links exit the site Exit
Links to Regional Greenhouse Gas Inventory (PDF) (19pp, 770K, About PDF), Climate Action Plan (PDF) (84pp, 2.92M, About PDF), and Implementation Guide (PDF) (993pp, 4.2M, About PDF)
Tribal Population: 3,000
As part of the Swinomish Climate Change Initiative, the tribal community developed a Climate Adaptation Action Plan in 2010. The Action Plan builds off of the initiative’s Impact Assessment; identifies priority sectors for adaptation action, including coastal and upland resources, human health, and community infrastructure and services; and presents an implementation strategy. The Action Plan also includes a section describing greenhouse gas mitigation activities that the tribal community has started to implement.
County Population: 104,000
Tompkins County has multiple initiatives and plans to help reach their community-wide emissions reduction target of 20% by 2020 from the 1998 baseline. The County developed a Local Action Plan for county government operations and a 2020 Energy Strategy for the community. Through EPA’s Climate Showcase Communities Program, Tompkins County documented how residential smart growth can be coupled with energy efficient residential development through the creation of the EcoVillage at Ithaca. Tompkins County is also a part of the broader Cleaner, Greener Southern Tier Regional Sustainability Plan and associated greenhouse gas inventory to facilitate regional sustainability decision-making.