RHC for Single-Family Homes
- About this sector
- Sector opportunities and challenges for project development
- Costs of RHC technologies
About this Sector
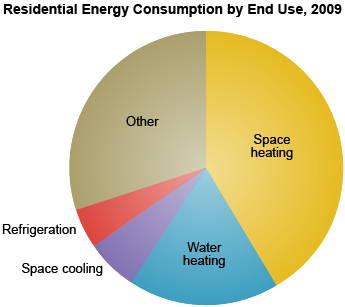
Data source: U.S. Energy Information Administration. 2012. 2009 Residential Energy Consumption Survey. Table CE3.1. Household Site End-Use Consumption in the U.S., Totals and Averages, 2009.
According the Energy Information Administration, the United States had nearly 79 million single-family homes in 2009 (not including mobile homes).1 These homes used more than 8 quadrillion Btu of energy for heating and cooling applications:2
- 3.4 quadrillion Btu on space heating
- 1.4 quadrillion Btu on water heating
- 0.5 quadrillion Btu on air conditioning
With more than 65 percent of total delivered residential energy use going toward heating and cooling applications,3 the residential sector represents a large opportunity for renewable heating and cooling technologies. The average household in a single-family home spends about 53 percent of its energy-related expenditures on heating and cooling, which adds up to about $92 billion per year nationwide.4
Sector Opportunities and Challenges for Project Development
Several factors make single-family homes good candidates for renewable heating and cooling (RHC) projects:
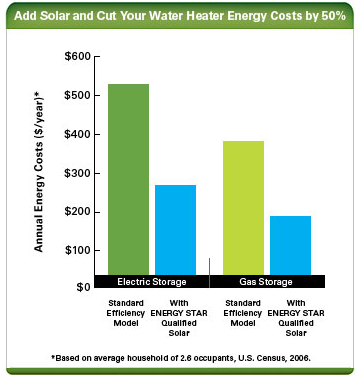
- Many renewable heating and cooling systems can cut a homeowner’s energy costs by as much as 50 to 80 percent (see graphic).
- Most types of renewable heating and cooling technologies can be easily integrated into most homes, including pool heating systems.
- American homes replace a large number of conventional heating and cooling systems each year, providing a natural opportunity to consider switching to a renewable system:
- Many homeowners can take advantage of federal and state incentives to help reduce the upfront cost of renewable heating and cooling systems. With incentives, renewable heating and cooling projects can often realize a return on investment in less than five to seven years.
Renewable heating and cooling projects in this sector also face some challenges:
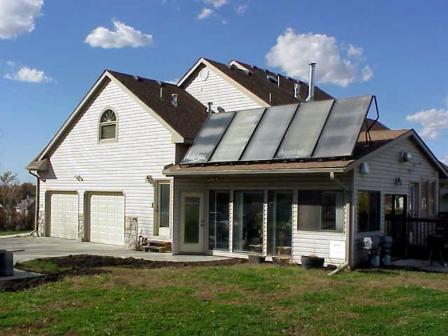
Credit: Ken Riead, NREL 10351
- Many local building departments are not as familiar with renewable heating and cooling technologies as they are with conventional technologies. Permitting costs can vary widely across different jurisdictions and in some cases make some projects uneconomical.
- Some residential sites may not be able to support renewable heating and cooling techonlogies due to resource access or technical limitations of the site. For example, shade can render some project sites ineffective for solar watering heating collectors, and many homes may not have enough square footage of area for the installation of underground geothermal heat exchange loops.
- High upfront costs involved with some systems can dissuade homeowners from investing in renewable heating and cooling technologies despite their long term finanical benefits.
Costs of RHC Technologies
The total cost of developing renewable heating and cooling systems can vary based on a number of factors, including the state policy environment, physical geography, available incentives, labor rates, and more. The following cost information is sourced from the National Renewable Energy Laboratory (NREL)7 and should not be interpreted as statistically accurate or sector-specific, but instead should be taken only as rule-of-thumb information and used only for a first-pass screen of economic viability. Visit NREL's website for more detailed information about other costs and typical project lifetimes.
| Technology type | Mean installed cost ($ per square foot) |
Installed cost range (+/- $ per square foot) |
Operation and maintenance cost |
|---|---|---|---|
| Solar water heating: flat-plate and evacuated tube collectors |
$141 | $82 | 0.5 to 1.0% of initial installed cost |
| Solar water heating: plastic polymer collector (unglazed) |
$59 | $15 | 0.5 to 1.0% |
| Technology type | Mean installed cost ($ per ton) |
Installed cost range (+/- $ per ton) |
Operation and maintenance cost |
|---|---|---|---|
| Ground source heat pump | $7,518 | $4,164 | $109 +/- $94 |
| Technology type | Mean installed cost* ($ per kilowatt) |
Installed cost range (+/- $ per kilowatt) |
Fixed operation and maintenance cost ($ per kilowatt) |
|---|---|---|---|
| Biomass wood heat* | $600 | $361 | $91 +/- $33 |
*Biomass wood heat converted from thermal energy capacity (Btu per hour)
- Learn more about solar, geothermal, and biomass technologies.
- Learn more about financial incentives for RHC.
1 U.S. Energy Information Administration. 2012. 2009 Residential Energy Consumption Survey. Table CE3.1 Household Site End-Use Consumption in the U.S., Totals and Averages, 2009.
2 U.S. Energy Information Administration. 2012. 2009 Residential Energy Consumption Survey. Table CE3.1 Household Site End-Use Consumption in the U.S., Totals and Averages, 2009.
3 U.S. Energy Information Administration. 2012. 2009 Residential Energy Consumption Survey. Table CE3.1 Household Site End-Use Consumption in the U.S., Totals and Averages, 2009.
4 U.S. Energy Information Administration. 2012. 2009 Residential Energy Consumption Survey. Table CE3.6 Household End-Use Expenditures in the U.S., Totals and Averages, 2009.
5 Air-Conditioning, Heating, and Refrigeration Institute. 2015. Residential Automatic Storage Water Heaters Historical Data. Exit Accessed September 2015.
6 Air-Conditioning, Heating, and Refrigeration Institute. 2015. Furnaces Historical Data. Exit Accessed September 2015.
7 National Renewable Energy Laboratory. 2013. Distributed Generation Renewable Energy Estimate of Costs. Updated August 2013.