T-REX Version 1.5 User's Guide for Calculating Pesticide Residues on Avian and Mammalian Food Items - Appendix B - Initial Pesticide Residues on Arthropods
TIM Version 3.0 beta Technical Description and User Guide - Appendix E. Initial Pesticide Residues on Arthropods
Project Team: Brian Anderson, Kris Garber, Christine Hartless, Tiffany Mason, Nick Mastrota, Ed Odenkirchen, Amanda Solliday, Ingrid Sunzenauer
- Abstract
- Introduction
- Methods
- Results and Discussion
- Assumptions and Uncertainties
- References Cited
-
Abstract
At this time, the EPA's Office of Pesticide Programs (OPP) Environmental Fate and Effects Division (EFED) uses the Terrestrial Residue EXposure (T-REX, v. 1.4.1) and Terrestrial Herpetofaunal Exposure Residue Program Simulation (T-HERPS, v. 1.1) models to estimate pesticide exposures through consumption of "small" and "large" insects. Both T-REX and T-HERPS assume that initial pesticide residues on plants are representative of residues on insects. The Terrestrial Investigation Model (TIM) includes empirical data for pesticide residues on arthropods. The data set that is in version 2.1 of TIM is limited by 2 major factors:
-
the insect residue data (i.e., Fischer and Bowers 1997) are compiled from several field studies and do not contain sufficient detail on individual study data to allow EFED review; and
-
the data are primarily based on arthropods collected using methods (i.e., pitfall traps) that are considered to bias the data towards arthropods with lower residue levels. Insects with high residues would likely be impaired to the point that they could not move into a trap.
Therefore, in order to reduce uncertainties associated with the current approaches used for estimating pesticide residues on arthropods in TIM, T-REX, and T-HERPS, this work was designed to obtain empirical data from the scientific literature and registrant-submitted studies to refine the initial residue assumptions of pesticides on arthropods that are simulated with these models. Conceptually, dietary exposures estimated in T-REX, T-HERPS and TIM are intended to represent pesticide residues on a treated field. For risk assessment purposes, estimated exposures should represent fields with initial residues from the upper bound of the distributions of all fields. For this analysis, "upper bound" is defined as the 90th percentile. For T-REX and T-HERPS, the upper-bound initial residue value is represented by the 90th percentile of 90th percentiles of field distributions, i.e., 94 RUD. This value is slightly higher than the highest individual residue value from the residue studies discussed above (i.e., 80 RUD from Martin et al. 1996). This value falls between the current upper-bound initial (peak) residue values used in T-REX for small and large insects, i.e., 135 and 15 RUD, respectively. TIM develops a distribution of initial pesticide residues based on a mean and SD. As with T-REX and T-HERPS, the initial mean value for TIM should be represented by the 90th percentile of the mean values (i.e., 65 RUD). This value is an order of magnitude higher than the mean used in TIM v. 2.1 to represent initial residues on insects (i.e., 5.72, from Fischer and Bowers 1997). The SD should be derived from the 90th percentile CV (74%) and the 90th percentile mean. The resulting SD is 48.
-
-
Introduction
In order to quantify exposures of mammals, birds, terrestrial-phase amphibians and reptiles to pesticides, it is necessary to quantify pesticide residues on arthropods1 that may be consumed by those taxa. At this time, EFED uses T-REX (v1.4.1) and T-HERPS (v1.1) models to estimate pesticide exposures through consumption of "small" and "large" insects. Both T-REX and T-HERPS assume an initial pesticide residue on food items. The current method for determining initial pesticide residues on small and large insects is based on the Fletcher et al. (1994) modification of the Hoerger and Kenaga (1972) plant residue data nomograms. The decision to use plant residue data as a surrogate for insect residue data was based on a dearth of invertebrate residue data and Kenaga's (1973) hypothesis that "initial residues on insects are probably in the same order of magnitude as those on plants of similar surface-area-to-mass ratios."
As early as 1999 it had been suggested that the uncertainty associated with extrapolating from plant data to arthropods be reduced by developing probabilistic distributions using invertebrate residue data (ECOFRAM 1999). This recommendation was considered in development of the Terrestrial Investigation Model (TIM), which incorporated empirical data for pesticide residues on arthropods. This approach was presented to two Science Advisory Panels (SAPs) (2001, 2004) and was supported by the Panels. The data set that is in TIM (v2.1) is limited by 2 major factors:
-
the insect residue data (i.e., Fischer and Bowers 1997) are compiled from several field studies and do not contain sufficient detail on individual study data to allow EFED review; and
-
the data are primarily based on arthropods collected using methods (i.e., pitfall traps) that are considered to bias the data towards arthropods with lower residue levels. Insects with high residues would likely be impaired to the point that they could not move into a trap.
Therefore, in order to reduce uncertainties associated with the current approaches used for estimating pesticide residues on arthropods in TIM, T-REX, and T-HERPS, a project was undertaken to improve the current empirical data set for pesticide residues on terrestrial arthropods.
T-REX, T-HERPS and TIM rely upon a defined initial pesticide residue on food items. This value is normalized to a part per million (mg a.i/kg) per 1 lb a.i./A application. The normalized value is called a residue unit dose or RUD. In T-REX and T-HERPS, an upper-bound and a mean initial residue value are used for both small and large insects2. For TIM, a log-normal distribution (based on mean and standard deviation) is used to represent pesticide residues on insects. In the models, the RUD is multiplied by the application rate of the pesticide of interest to determine the initial residue concentration.
Empirical data are also available from field and laboratory studies where pesticide residues were quantified on arthropods. In general, the purpose of these studies was to quantify pesticide residues on food items of birds using agricultural fields after pesticide applications were made. The results of these studies have been published in the scientific literature and have also been submitted to the EPA in order to support specific pesticide registrations. Additionally, a literature search was conducted in order to identify studies containing initial pesticide residue concentrations on arthropods. The terms for this literature search are provided below. In this research, "initial residue" is defined as any pesticide concentration (in ppm per 1 lb a.i./A or RUD) on arthropods that were collected ≤ 24 hours after the pesticide application. OPP's OPPIN was also searched to identify registrant submitted studies containing initial pesticide residues on arthropods. The search strategy for OPPIN is also provided below. All relevant studies that were identified were reviewed by EFED scientists. The rejection criteria for data are also provided below.
1 Note that two different terms are used in this introduction: arthropods and insects. The two are not interchangeable. Arthropods represent a phylum (Arthropoda) of invertebrate animals that have a segmented body that is covered by an exoskeleton. The Arthropoda phylum includes several classes of invertebrates that represent potential prey of terrestrial animals, one of which is the insect class (Insecta) as well as Arachnida (e.g., spiders), Chilopoda (centipedes) and Diplopoda (millipedes).
2 T-REX and T-HERPS assume initial upper bound residues of 135 RUD and 15 RUD for small and large insects, respectively. The mean residues for small and large insects are 45 and 7 RUD, respectively. EFED uses the upper bound residues to quantify risk quotients, while the mean residues are used to qualitatively describe potential risks.
-
-
Methods
-
3.1 Literature Search
An open literature search was conducted to identify pesticide residue studies for arthropods. Keywords such as insect, invertebrate, arthropod, pesticide, and residue were used on a variety of publication search engines as well as ECOTOX. Search results were screened for relevance to invertebrates and pesticides. Over 100 studies were collected, many of which contained no data relevant to terrestrial arthropods. Many studies also contained results of toxicity or efficacy studies with insecticides. After the initial search, the references in the papers containing data on pesticide residues on arthropods located on treated fields were reviewed in order to obtain additional studies.
-
3.2 OPPIN Search
A search was performed in OPPIN for Guideline 71-5 studies (Simulated or Actual Field Testing). All Guideline 71-5 study titles were screened to identify those potentially containing arthropod residue data. In addition, a key word search was performed in OPPIN for "insect residues" and "arthropods." The full study reports of the relevant titles were briefly reviewed to determine if they actually contained arthropod residue data. In order to identify additional studies (that were not submitted under guideline 71-5), containing pesticide residues on arthropods, OPPIN was also searched using the authors of the studies known to contain pesticide residue data for arthropods.
-
3.3 Rejection Criteria for Studies
Because the goal of this project was to obtain initial pesticide residues on arthropods located on a treated field at the time of application, studies were not considered useful if they did not report pesticide residues on arthropods collected ≤ 24 hours (or ≤ 1 day) after the pesticide application.
The available studies involved a wide variety of arthropod collection methods. Data were not considered useful if the collection method interfered with the application of the pesticide to the arthropod. For instance, several studies were available where arthropods were housed in enclosures located on treated fields. These enclosures were covered with mesh (to keep the arthropods inside), which may have intercepted some of the applied pesticide, resulting in an underrepresentation of the pesticide residues on the arthropods. Also, data were not considered useful in cases where the collection method obtained arthropods that were expected to under represent the pesticide residues on arthropods located on the treated field. All data where arthropods were collected using light traps were not considered because it is expected that this method would attract and, thus, collect (flying) arthropods from outside of the treated area. Also, data where arthropods were collected using pitfall traps were not considered for insecticides that were expected to quickly (i.e., within 1 d) kill insects located on the treated field. Exclusion of pitfall traps is based on a bias of this method described by Luttik (2001). After the initial insecticide spray in which some moribund insects may incidentally fall into the traps, only invertebrates that are mobile would be trapped. These insects may only be mobile because they did not receive a lethal dose of pesticide, hence underestimating residues. Application methods that were considered valid included: pinning, use of enclosures, use of knockdown spray and hand collection combined with sweepnets.
-
3.4 Reviews of Studies
All studies that were not rejected according to the criteria described in section 3.3 were reviewed by two different EFED scientists.
In order to be consolidated into one database, initial pesticide residues on arthropods must be standardized to the same units. As indicated above, the customary practice (from Hoerger and Kenaga 1972) is to normalize the residues to a ppm per 1 lb a.i./A application rate or RUD, assuming that the residue level of a given surface area is directly proportional to the application rate. Therefore, for this analysis, the reviewers converted all initial residue values to be equivalent to RUD by dividing the residue concentrations (in ppm) by the reported application rate (in lb a.i./A). All concentrations are based on wet weight. When % method recovery was reported, the reviewers converted the initial residue values to represent 100% recovery.
-
-
Results and Discussion
-
4.1 Scientific Open Literature
A total of 22 studies containing suitable pesticide residue data on arthropods were located in the scientific literature (Table B.1). Of these studies, 7 were used to quantify initial residues. The rationales behind excluding the other 15 studies are provided below.
Table B.1.
Scientific Literature Containing Pesticide Residues on ArthropodsCitation Used for quantifying initial residues? Rejection Reason Bennett et al. 1986 no No residues collected ≤ 24 h after pesticide application. Bennett et al. 1983 no No residues collected ≤ 24 h after pesticide application. Brewer et al. 1988 no No residues collected ≤ 24 h after pesticide application. Brewer et al. 2003 no These data were also submitted to EPA in detailed reports Clements et al. 1988 no The collection method was not described in this article. Davis 1968 no Article did not link specific pesticide application to observed residues. Davis and French 1969 yes Not applicable Davis and Harrison 1966 no Article did not link specific pesticide application to observed residues. DeReede 1982 no No residues collected ≤ 24 h after pesticide application. El Sayed et al. 1967 no No residues collected ≤ 24 h after pesticide application. Fair et al. 1995 no No residues collected ≤ 24 h after pesticide application. Forsyth and Martin 1993 yes Not applicable Forsyth and Westcott 1994 yes Not applicable Hamilton et al. 1981 no No residues collected ≤ 24 h after pesticide application. Hanny and Harvey 1982 no Bees were collected off of the treated field. Residues on dead bees collected near off-field hives may under represent residues of bees on the treated field. Leighton et al. 1987 no Article did not link specific pesticide application to observed residues. Levin et al. 1968 no Article did not define pesticide application rate. Martin et al. 1996 yes Not applicable Powell 1984 yes Not applicable Richards et al. 2000 no No residues collected ≤ 24 h after pesticide application. Stromborg et al. 1984 yes Not applicable Stromborg et al. 1982 yes Not applicable -
4.1.1 Literature studies that were not used to quantify initial residues
Several studies were not used to quantify initial residues on arthropods because they did not contain results from samples collected ≤ 24 hours (or ≤ 1 day) after the pesticide application (Bennett et al. 1986; Bennett et al. 1983; Brewer et al. 1988; DeReede 1982; El Sayed et al. 1967; Fair et al. 1995; Hamilton et al. 1981; Richards et al. 2000).
Data from Clements et al. 1988 were not used because the collection method was not described in the article.
Davis and Harrison 1966, Davis 1968, Leighton et al. 1987 and Levin et al. (1968) were not used because the rates of the pesticide applications that led to the residues in the arthropods were not provided. Therefore, the reported residues could not be converted to a RUD basis.
Data from Brewer et al. (2003) were not used because the studies described in this article were also submitted in detailed reports to the EPA (MRIDs 446447-01 and -02) and would have duplicated data already captured in the database. The reviews of these submissions are provided below in the Registrant-submitted Studies section.
Data from Hanny and Harvey (1982) were not included because this study involved collection of honey bees near their hives, which were not located on the treatment site. Therefore, this method allowed collection of dead honey bees that had been exposed to pesticide levels that were not sufficient to kill them on the treated field. The method did not allow for collection of honey bees that may have been exposed to higher levels of pesticide that were sufficient to kill them on the treated site. Therefore, the reported residues may under report pesticide residues on honey bees located on the treatment site.
-
4.1.2 Literature studies that are used to quantify initial residues
A total of 7 studies published in the scientific literature contained data for initial pesticide residues on arthropods located on the treated field at the time of application. Available studies measured initial residues on grasshoppers, insect larvae and beetles. These studies are described below.
Forsyth and Westcott (1994) provide initial carbofuran (carbamate insecticide) residue data for grasshoppers collected in 1987 and 1988 from two different pastures located in Saskatchewan, Canada. Each pasture was divided into two plots, with four sample sites per plot. After the carbofuran application (0.120 lb a.i./A), live grasshoppers were collected from the treated field using sweep nets. Dead or dying grasshoppers were collected from the treated areas by hand (using forceps). Samples represented a composite of individual grasshoppers from different species. In 1987, the average sample size was 43 individuals (range: 8-100; average sample weight: 3.87 g). In 1988, the average sample size was 14 individuals (range: 3-31; average sample weight: 1.26 g). The article reported mean and standard deviations for each sampling time period (3, 8 or 24 hours after application). The study authors reported that there was no statistical difference between the mean concentrations measured at the three time periods. Initial mean carbofuran residues on live and dead grasshoppers ranged from 3 to 26 RUD and 18 to 37 RUD, respectively. The means of the 1987 and 1988 initial carbofuran residues on grasshoppers (alive and dead) were 15.0 and 26.6 RUD, respectively.
Stromborg et al. (1984) provide initial residues of acephate plus methamidophos (a degradate of acephate; both are organophosphate insecticides) on grasshoppers collected from two prairie rangeland sites located in Sweet Grass County, Montana. Grasshoppers were collected from the treated fields at 4 h after the application of acephate (0.548 lb a.i./A). Live grasshoppers were collected from treated fields using sweep nets. Immobilized (sick or dead) grasshoppers were picked up by hand. Each sample was 6-14 g, representing a composite of 120-280 individuals (5 g sample was analyzed). The total initial residues of acephate and methamidophos on live and sick/dead grasshoppers were 21 and 28 RUD, respectively.
Martin et al. (1996) collected individuals of 3 species of grasshoppers from a field in Alberta. In the laboratory, formulated products containing carbofuran (carbamate insecticide), dimethoate or chlorpyrifos (organophosphate insecticides) were applied via a track sprayer to the grasshoppers at 2 different field equivalent rates per pesticide. Grasshoppers were anesthetized and then arranged 62 cm below the spray nozzle for a single pesticide application. Individually measured residues ranged from 13-80 RUD for all three pesticides, with mean (standard deviation) values of 17.8 (3.95), 60.0 (3.56) and 70.8 (7.80) RUD for dimethoate, carbofuran and chlorpyrifos (respectively). Individually reported values for each pesticide were pooled from two different application rates. The data from the laboratory study conducted by Martin et al. (1996) are expected to represent high-end initial residues of pesticides on grasshoppers.
Stromborg et al. (1982) provide initial residues of diazinon (organophosphate insecticide) on tobacco hornworms (Manduca sexta; target pest) and tomato hornworms (M. quinquemaculata) collected from tobacco plants and the ground of treated areas. Diazinon was applied by ground spray at 0.75 lb a.i./A. The study site was located in Maryland. Samples were collected 4 h and 24 h after application. Each sample weighed at least 5 g and represented a composite of hornworms. Hornworm samples were divided into those with parasite cocoons (Apanteles sp.) and those without. Residues on parasitized hornworms located on plants were 0.35 and 0.91 RUD at 4 h and 24 h after application, respectively. For parasitized hornworms located on the ground, residues were 0.20 and 0.37 RUD, respectively. Non-parasitized hornworms located on plants had initial residues (collected 4 h and 24 h after application), ranging from 0.20-0.43. One initial residue is available for non-parasitized hornworms located on the ground (3.3 RUD). This value is considered an outlier (determined using Dixon's test for outliers (Dixon 1950)) and was not considered in calculating the mean of the initial pesticide residues for this study. The reviewer-calculated mean (arithmetic) of all of the measured residues (excluding non-detects) reported by Stromborg et al. (1982), regardless of parasitism, collection time (samples collected at 4 h and 24 h were pooled) or sample location, was 0.37 (standard deviation = 0.23) RUD.
Forsyth and Martin (1993) report initial fenitrothion (organophosphate insecticide) residues on spruce budworm larvae (Choristoneura fumiferana; target pest) removed from branches of two treated fir trees. Fenitrothion was applied by aerial application at 0.19 lb a.i./A. Larvae samples were collected at 3 h and 24 h after fenitrothion application. Larvae collected at each time period were pooled into one sample per tree, resulting in 30-50 individuals per sample. The four reported samples ranged from 1.6 to 6.3 RUD. The reviewer calculated mean (arithmetic) of the four residue values reported by Forsyth and Martin, regardless of collection time (3 h or 24 h), was 3.7 (standard deviation = 1.13).
Powell (1984) provides an initial fenthion (organophosphate insecticide) residue value from a sample of owlet moth larvae (Polia sp.) collected from the treated site 8 h after the application. The study site was a hay meadow located in Laramie, Wyoming. Fenthion was applied by aerial application at 0.046 lb a.i./A. Samples of larvae were collected using sweep nets. A single initial residue value of 6.1 RUD is available from this study. The article indicates that the meadow was divided into 16 transects, so it is assumed that the reported initial residue value represents a mean of at least 16 samples. The standard deviation is not reported.
In a study conducted by Davis and French (1969) during summer of 1967, DDT, an organochlorine insecticide, was applied at a rate of 2.5 lb a.i./A to a pea field located in England. Dead ground beetles (Feronia melanaria) were pinned to the pea field and collected immediately after application. Residues of pp'-DDT (22 RUD), op'-DDT (5.6 RUD), pp'-DDE (0.52 RUD) and pp'-TDE (0.68 RUD) were quantified in the beetles. The majority (95%) of the reported residues were composed of DDT. The mean of the total DDT residues (including metabolites) was 29 RUD (n = 4; each replicate contained approximately 5 beetles). Coefficients of variation (CV=[standard deviation ÷ mean] x 100) of the individual residues averaged 26%. If the average CV were applied to the mean of the total DDT residues, the resulting average standard deviation would be 7.5.
-
-
4.2 Registrant-Submitted Studies
A total of 22 registrant-submitted studies containing data on pesticide residues on arthropods were located in OPPIN (Table B.2). Of these studies, 7 were used to quantify initial residues. The rationales behind excluding the other 15 studies are provided below.
Table B.2.
Registrant-submitted Studies Containing Pesticide Residue on ArthropodsMRID Used for quantifying initial residues? Rejection Reason 41548801 No Pitfall traps were used to collect arthropods. Sweep nets were also used to collect arthropods; however, insufficient details were reported regarding how sweep netting was performed to allow for an evaluation of its utility in the analysis. 41548802 No 41548803 No Pitfall traps were used as the sole source of arthropod collection 41585001 No 41785102 No 41785103 No 42285501 No 42285503 No 42437301 No 42721301 No 42791101 No 43730301 No 44464201 No It is uncertain if organisms were on cotton plants during pesticide application. 44644701 Yes Not applicable 44644702 Yes Not applicable 44692401 Yes Not applicable 44806601 Yes Not applicable 44875301 No Pesticide applied in furrow 45135901 Yes Not applicable 46817024 Yes Not applicable 47699440 Yes Not applicable 47699441 No This study summarizes data from MRID 47699440. -
4.2.1 Registrant-submitted studies that were not used to quantify initial residues
Ten registrant-submitted studies (MRIDs 41548803, 41585001, 41785102, 41785103, 42285501, 42285503, 42437301, 42721301, 42791101 and 43730301) were not used to quantify initial pesticide residues on arthropods because pitfall traps were used as the sole source of arthropod collection. All of these studies were conducted with insecticides where acute effects to arthropods may have occurred. As indicated previously, high mortality of arthropods may result in a biased sample towards individuals with lower concentrations because dead or dying insects, which presumably have higher residue levels compared with live insects given similar sensitivities, would be unable to enter pitfall traps.
In MRIDs 415488-01 and -02, arthropods were separated into two groups: those collected in pitfall traps and those collected in sweep nets. Both studies involved applications of an organophosphate insecticide. As indicated above, pitfall trap data are not considered for quantifying initial pesticide residues when acute effects to arthropods are expected from the pesticide application. Sweep nets were also used in these studies; however, insufficient details were reported regarding how sweep netting was performed to allow for an evaluation of its utility in the analysis. As with the pitfall trap data, use of sweep nets may underestimate pesticide residues on arthropods by excluding dead arthropods and by including arthropods that were not present on the treatment site at the time of the pesticide application (i.e., they flew in from non-treated areas).
MRID 44464201 was not included because it is uncertain if the arthropods that were analyzed for pesticide residues were sprayed directly since the insects reportedly entered the soil soon after they were placed onto cotton plants. Therefore, the test organisms may not have been subject to direct spray.
MRID 44875301 was not included because the pesticide application involved in-furrow methods. Therefore, the application was not representative of foliar applications to crops.
MRID 47699441 was not included because the report contained a summary of data from MRID 47699440, which is described below, and thus would have duplicated existing data.
-
4.2.2 Registrant-submitted studies that were used to quantify initial residues
A total of 7 registrant-submitted studies contained data for initial pesticide residues on arthropods located on the treated field at the time of application. Available studies measured initial residues on crickets, insect larvae, beetles, and arthropods (wild) dwelling in the foliage of the treated site. These studies are described below.
For this analysis, in cases where more than one taxonomic group was evaluated in the same field study (e.g., adult crickets and larvae), the means and standard deviations represent pooled values across the taxonomic groups to represent the initial pesticide residues from the study field. However, residues obtained from a laboratory study (MRID 47699440) were considered separately from the field studies from the same submission. Several field studies included enclosures for containing exposed arthropods. Data were only included when the cover of the enclosure was removed at the time of the application in order to prevent interception of the pesticide by the enclosure.
MRID 45135901: An aerial application of fipronil, a phenylpyrazole insecticide, was made at 0.075 lbs a.i./A to a 4-acre cotton field located in Mississippi. A total of 4 applications were made 7 to 10 days apart during the morning hours. Fipronil residues on arthropods were measured 0, 1, 3, and 7 days after the first and fourth applications. Within each main plot, each subplot contained a total of two cricket (Acheta domestica) enclosures on the ground, and one beet armyworm larvae (Spodoptera exigua) enclosure on the ground during the study period. Wild crickets were included in the sampling when found during collection. All crickets were dead at approximately 30 hours post application. Additional crickets were added to the enclosures reportedly to simulate immigrating crickets. These crickets also were dead or dying by day 3. Mortality was not observed in armyworm larvae. For this analysis, samples collected on day 0 and 1 d after the application were considered for determining the initial concentration of fipronil on arthropods. Data collected after applications 2, 3 and 4 were not considered for defining initial pesticide residues because they may be elevated due to previous applications. All initial residue data (samples collected at 0 and 1 d were combined) for crickets and larvae were pooled to calculate a mean and standard deviation of 4.79 and 1.87 RUD, respectively.
MRID 44692401: Carbofuran was applied using ground spray equipment at 1 lb a.i./A to a 3-acre alfalfa field located in Iowa. The field was divided into 3 plots with 4 subplots; each subplot was used. The study evaluated carbofuran residues on crickets (Acheta domestica) and armyworm larvae (Pseudaletia unipuncta) and cutworm larvae (Agrostic ipsilon) contained in enclosures located on the ground. Samples were collected at 0.08 d (i.e., 2 h), 1 d, 3 d and 7 d after the carbofuran application. For this analysis, samples collected 2 h and 1 d after the application were considered for determining the initial concentration of carbofuran. All initial residue data (samples collected at 2 h and 1 d were combined) for crickets, and larvae were pooled to calculate a mean and standard deviation of 5.01 and 3.74 RUD, respectively.
MRID 44644702: Chlorpyrifos, an organophosphate insecticide, was applied via ground to alfalfa fields located in Iowa at a rate of 1.0 lb a.i./A. The application site was divided into 3 plots, each of which was divided into 4 subplots. Crickets (Acheta domestica) and beet army worm larvae (Spodoptera exigua) were placed in separate enclosures located on the ground of the treated subplots. Samples were collected at 0.08 d (i.e., 2 h), 1 d, 5 d and 10 d after the chlorpyrifos application. For this analysis, samples collected 2 h and 1 d after the application were combined to determine the initial concentration of chlorpyrifos. All initial residue data (2 h and 1 d) for crickets and larvae were pooled to calculate a mean and standard deviation of 3.25 ± 2.7 RUD, respectively.
MRID 44644701: Chlorpyrifos was applied via air blast to an orange grove located in California at a rate of 2.0 lb a.i./A. The application site was divided into 3 plots, each of which was divided into 4 subplots. Darkling ground beetle (Tenebrio molitor) larvae were pinned in place on one randomly chosen citrus tree per sub-plot prior to treatment. Larvae samples were collected from each of the 12 subplots located on the orchard. Samples were collected at 0.08 d (i.e., 2 h), 1 d, 5 d and 10 d after the chlorpyrifos application. For this analysis, samples collected 2 h and 1 d after the application were considered for determining the initial concentration of chlorpyrifos. The mean and standard deviation of the initial (samples collected at 2 h and 1 d were combined) chlorpyrifos concentration on larvae were 4.27± 0.7 RUD.
MRID 44806601: A single application of methidathion, an organophosphate insecticide, was made via air blast to mature orange groves in Fresno County, California at 10 lbs a.i./A. Arthropod species exposed in this study were darkling ground beetle (Zophobus morio) larvae pinned to trees prior to application. Samples were collected at 0 d, 1 d, and 3 d after the methidathion application. For this analysis, samples collected on days 0 and 1 were combined to determine the mean of 3.46 RUD and standard deviation of 1.58 for the initial concentration of methidathion on arthropods.
MRID 46817024: Flubendiamide, a diamide insecticide, was applied to a German vineyard 4 times every 14 days using ground equipment at a rate of 0.14 lbs a.i./A. A knockdown organophosphate insecticide (DDVP) was then used to facilitate the collection of arthropods located on the canopy of the flubendiamide-treated vines. Arthropods were then collected off of a tarp placed beneath the vine. During the study, samples were taken after each application on Days 0, 1, 3, 5, 7, 10, 13 and additionally on 21, 35 and 55 days after the last application. For this analysis, samples collected on day 0 and day 1 after the first application were considered for determining the initial concentration of flubendiamide. Data collected after applications 2, 3 and 4 were not considered for defining initial pesticide residues because they may be elevated due to previous applications. All initial residue data (samples from days 0 and 1 were combined) for arthropods were pooled to calculate a mean and standard deviation of 7.71 ± 3.95 RUD.
MRID 47699440: Imidacloprid, a neonicotinoid insecticide, was applied as a ground spray in a pome fruit orchard in Germany (apple and pear trees) at a measured rate of 0.088 lb a.i./A. Natural occurring arthropods were collected using an inventory spray. The purpose of the inventory spray was to capture arthropods which inhabit canopies of orchard trees. A volatile insecticide DDVP was used as the knockdown insecticide. Draperies were placed below 3 trees on both sides and fixed to catch falling arthropods on trees. Imidacloprid was applied to approximately 6 to 12 trees for each spray. Inventory spray of arthropods was conducted 2 to 4 times each at days -5, -4, -3, 0 (about 7 h after the application of imidacloprid), and 1 time/day on days 1, 5, 7, 10, 13, 17 and 21 by applying DDVP to the canopy. The study report noted that canopy-dwelling arthropods were primarily Diptera (61%), Dermaptera (13%), Arachnida (7%), Heteroptera (7%), Hymenoptera (3% including Formicidae), and other orders (8%). For this analysis, samples collected on days 0 (7 h) and 1 (24 h) after the application were combined to determine the initial concentration of imidacloprid. The mean and standard deviation of the initial imidacloprid concentration on canopy dwelling arthropods were 11.35 ± 3.73 RUD.
MRID 47699440: This study also included analysis of initial imidacloprid residues on beetles (Phaedon cochleariae) that were sprayed in a laboratory at 0.094 lb a.i./A and then placed in enclosures located in a German pome fruit orchard that was involved in the study described in the previous paragraph. Samples were taken at the same schedule as the DDVP canopy spray. No beetles died as a result of treatment. For this analysis, samples collected 7 h after the imidacloprid application were considered for determining the initial concentration of imidacloprid. The mean and standard deviation of the initial imidacloprid concentration on beetles were 54.55 ± 5.17 RUD.
Several of the studies discussed in this section also included data that were not used to quantify initial pesticide residues on arthropods. Data from samples collected using pitfall traps (MRIDs 44644702, 44692401, 46817024 and 47699440) were not used because of reasons described above (Section 3.2.1). Data corresponding to flying insects captured using light traps (MRIDs 44644702, 44692401) were not used because these methods may result in an underestimation of pesticide residues on arthropods by excluding dead arthropods and by including arthropods that were not present on the treatment site at the time of the pesticide application (i.e., they flew in from non-treated areas). In some cases, ground-dwelling arthropods kept in enclosures during the application were excluded from consideration for defining initial pesticide residues on treated fields because the applications involved air blast, which directs the pesticide up onto the tree and its canopy (MRIDs 44644701 and 44806601). The ground-dwelling arthropods were not considered in this study because they may underestimate pesticide residues on arthropods directly sprayed by the pesticide.
-
-
4.3 Distribution of all available initial residue data
The purpose of this analysis was to use the empirical data described above (and summarized in Table B.3) to characterize the distribution of initial pesticide residues on arthropods located on all treated fields. This analysis was accomplished using a dual loop approach where the means and CVs of the empirical data were fitted to a distribution, and the distribution was used to generate random values representing 100 individual fields (first loop). Random values from the 100 fields were then used to generate the distribution of pesticide residues on all treated fields (second loop). The details of this approach are described below.
For each study described above containing initial pesticide residue data for arthropods, a mean, standard deviation (SD), CV and corrected CV (CVc = CV * (1+1/(4N)); Sokal and Rohlf 1995) were derived (if possible) for all arthropods collected from the same study considering one type of application (Table B.3). CVs were corrected to account for bias due to small sample size. Three separate values were derived from the data presented in Martin et al. (1996) in order to represent the three different chemicals analyzed.
Table B.3.
Mean, SD and CV Values Representing Initial (≤ 1d After Application) Pesticide Residues on Arthropods Located on Treated FieldsArthropod description Chemical Study type Mean* SD* n standard CV corrected CV Source Tobacco hornworms (Manduca sexta) diazinon field 0.37 0.23 8 63% 65% Stromborg et al. 1982 Darkling ground beetle larvae (Zophobus morio) methidathion field 3.46 1.58 6 46% 48% MRID 44806601 Darkling ground beetle larvae (Tenebrio molitor) chlorpyrifos field 4.27 0.7 6 16% 16% MRID 44644701 Crickets (Acheta domestica) + Beet army worm larvae (Spodoptera exigua) chlorpyrifos field 3.25 2.7 12 84% 86% MRID 44644702 Spruce budworm (Choristoneura fumiferana) fenitrothion field 3.70 1.13 4 31% 32% Forsyth and Martin 1993 Crickets (Acheta domestica) + insect larvae (Agrostic ipsilon and Pseudaletia unipuncta) carbofuran field 5.01 3.74 13 75% 76% MRID 44692401 Crickets (Acheta domestica) + armyworms (Spodoptera exigua) fipronil field 4.79 1.87 13 39% 40% MRID 45135901 Owlet moth larvae (Polia sp.) fenthion field 6.10 NR NR NR NA Powell 1984 Foliage dwelling arthropods flubendiamide field 7.71 3.95 4 51% 54% MRID 46817024 Canopy arthropods imidacloprid field 11.35 3.73 6 33% 34% MRID 47699440 Grasshoppers dimethoate laboratory 17.75 3.95 4 22% NA Martin et al. 1996 Grasshoppers (alive+ dead; collected in 1987) carbofuran field 15.00** NR NR NR NA Forsyth and Westcott 1994 Grasshoppers (healthy + sick) acephate + methamidophos field 24.50*** NR NR NR NA Stromborg et al. 1984 Grasshoppers (alive + dead; collected in 1988) carbofuran field 26.60** NR NR NR NA Forsyth and Westcott 1994 Ground beetle (Feronia melanaria) DDT+degradates field 29.00 NR NR NR NA Davis and French 1969 Beetles (Phaedon cochleariae) imidacloprid laboratory 54.55 5.17 4 9% NA MRID 47699440 Grasshoppers carbofuran laboratory 60.00 3.56 4 6% NA Martin et al. 1996 Grasshoppers chlorpyrifos laboratory 70.75 7.80 4 11% NA Martin et al. 1996 NR = not reported; NA = not applicable
* units = ppm per 1 lb a.i./A = RUD
** Mean of reported mean values from samples collected at 3, 8 and 24 h after application.
*** Mean of reported mean values from samples collected 4 h after application.
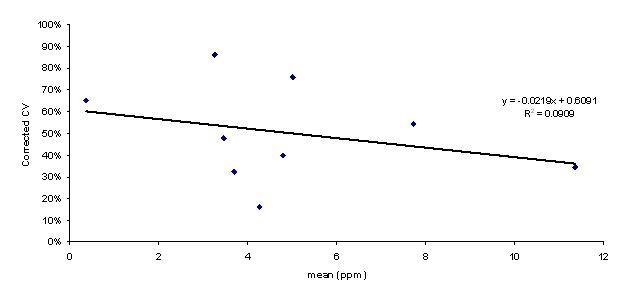
When all mean values were considered, they were log-normally distributed (as determined using Shapiro-Wilk and Anderson Darling tests), with a mean (±SD) of 23.9 (±51.8) RUD. Due to limited variables present in laboratory studies compared to the field, CVs from laboratory studies (Martin et al. 1996 and MRID 47699440) were not considered in the overall distribution of CVs. The CVs of the field data were normally distributed (determined using Shapiro-Wilk and Anderson Darling tests), with a mean (±SD) of 50% (±22%). A comparison of the mean values and their respective corrected CVs indicates that these values are likely independent of each other (i.e., R2 = 0.09; Figure B.1).
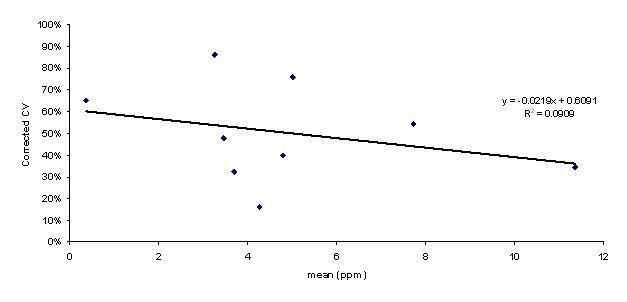 Figure B.1
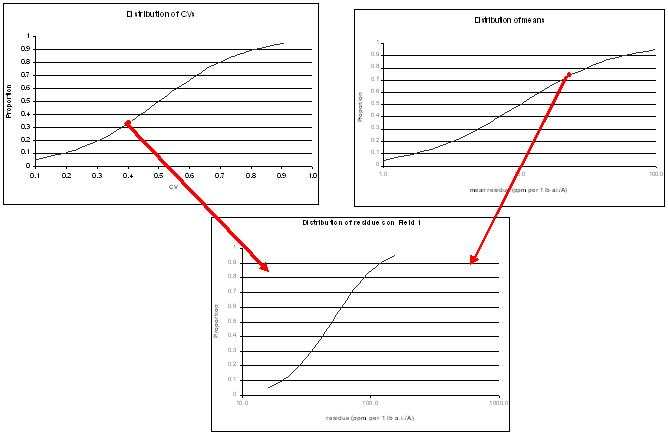
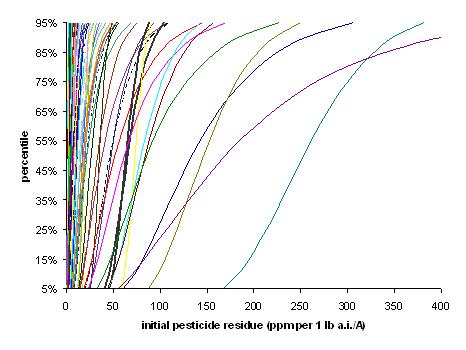
Relationship between mean and corrected CVs of empirical dataAn individual field was simulated by randomly selecting a mean and a CV from the distributions of means and CVs from the study data (Figure B.2). A Monte Carlo simulation was then conducted using Crystal Ball TM 2000 (v.5.1) where 10,000 random values were generated for each field and the summary statistics and percentiles were calculated. This procedure was repeated 99 more times to generate distributions of initial residues on 100 fields (Figure B.3). Table B.4 presents the mean, median and 90th percentile of the means, CVs, and various percentiles (specifically: 5th, 10th, 25th, 50th, 75th, 90th, and 95th) of the 100 simulated fields.
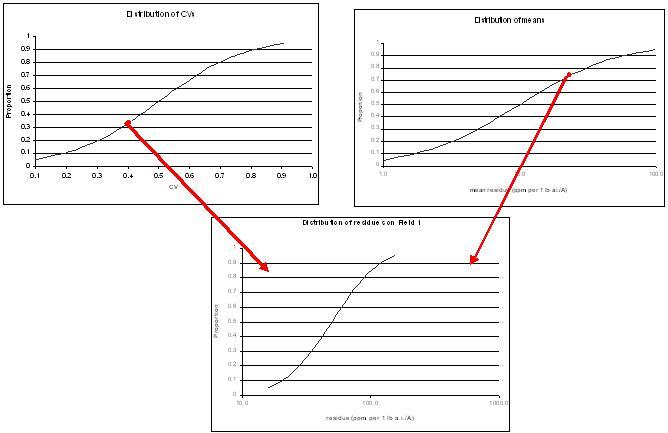 Figure B.2.
A mean and a CV are randomly selected from their respective distributions (top two graphs based on Table 3) to derive distributions of residues on different fields (see Figure 3)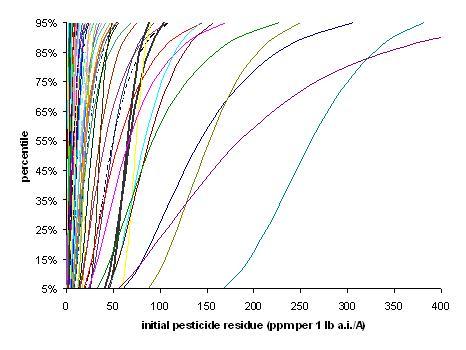 Figure B.3
Distributions of initial pesticide residues on 100 simulated fields. The thick black lines represent the fields with the 90th and 91st highest means of the 100 simulated fields.Table B.4.
Mean, median and 90th and 95th percentiles of individual field means, CVs and percentiles.
All units in RUD (except CVs).Field statistic Mean Median 90th percentile Mean 23.7* 7.9 64.9 CV 49% 49% 74% 5th percentile 10.9 3.4 27.9 10th percentile 12.6 4.0 33.2 25th percentile 17.0 5.5 46.3 50th percentile 21.2 6.8 61.9 75th percentile 28.5 9.5 78.8 90th percentile 37.5 12.4 94.4 95th percentile 44.6 14.8 110 * This value represents the mean of the field means. This value is similar to the mean of the empirical means (i.e., 23.9 RUD).
-
4.4 Recommended values for T-REX, T-HERPS and TIM
Conceptually, dietary exposures estimated in T-REX, T-HERPS and TIM are intended to represent pesticide residues on a treated field. For risk assessment purposes, estimated exposures should represent fields with initial residues from the upper bound of the distributions of all fields. For this analysis, "upper bound" is defined as the 90th percentile. The use of the 90th percentile is consistent with the percentile selected to represent a high-end exposure in EFED's aquatic exposure modeling (i.e., the 1-in-10 year EEC generated by PRZM/EXAMS is used to represent aquatic EECs).
For T-REX and T-HERPS, the upper-bound initial residue value is represented by the 90th percentile of 90th percentiles of the field distributions, i.e., 94 RUD. This value is representative of a high-end initial pesticide residue on the 90th highest of 100 ranked fields. The selected value is slightly higher than the highest individual residue value from the residue studies discussed above (i.e., 80 RUD from Martin et al. 1996). This value falls between the current upper-bound initial (peak) residue values used in T-REX for small and large insects, i.e., 135 and 15 RUD, respectively. This recommendation results in one initial pesticide residue for all arthropods, regardless of size. T-REX and T-HERPS will no longer distinguish between small and large insects.
T-REX and T-HERPS also use a mean residue value for characterization purposes. For these models, the initial mean value should be represented by the 90th percentile of the mean values (i.e., 65 RUD). This value is representative of the mean residue value on the 90th highest of 100 ranked fields and falls between the two highest empirical mean values (i.e., 60 and 71 RUD from Martin et al. 1996). This value is higher than the current mean initial residue values used in T-REX for small and large insects, i.e., 45 and 7 RUD, respectively.
TIM develops a distribution of initial pesticide residues based on a mean and SD. As with T-REX and T-HERPS, the initial mean value for TIM (v.3.0) should be represented by the 90th percentile of the mean values (i.e., 65 RUD). This value is an order of magnitude higher than the mean used in TIM v. 2.1 to represent initial residues on insects (i.e., 5.72, from Fischer and Bowers 1997). The SD used in TIM v.3.0 should be derived from the 90th percentile value CV (74%) and the 90th percentile mean (i.e., 0.74 * 65 = 48).
-
-
Assumptions and Uncertainties
It is assumed that the available initial residue data are representative of residues on arthropods that are food items for birds and mammals foraging in areas treated with pesticides. The data set used in this analysis represents a relatively small set of arthropods (i.e., grasshoppers, crickets, beetles and several insect larvae). These arthropods are larger in size than other arthropods that may serve as food items to birds and mammals (e.g., mosquitoes, flies and gnats). It is also assumed that the available data are representative of arthropods of various locations on the field (e.g., ground, canopy). Limited data were collected on naturally occurring arthropods located in the canopy of a vineyard and orchard, which included a larger variety of taxonomic groups of arthropods. It is uncertain how representative the data set is to the variety of arthropods that represent the diets of mammals and birds.
Currently in T-REX, EECs are calculated for "small" and "large" insects. The distinction between the two size categories relates to relationships between surface area and mass. When extrapolating from plant data, Kenaga (1973) predicted that concentrations would be greater on smaller insects because of the increased surface area to mass ratio (i.e., there is more area for the pesticide to be deposited on in relation to mass). We would expect this relationship to be conserved if there were actual data available for smaller species of insects; therefore, pesticide residue concentration predictions may be underestimated for insects that are smaller in size than those considered in this database.
The database of empirical initial pesticide residues on arthropods contains data from laboratory and field studies. It is assumed that the laboratory study results are high-end mean residues that are representative of arthropods located on treated fields. The data collected from laboratory studies are influenced by fewer variables compared to the data collected from the field. In the field studies, residue values may have been influenced by variables such as weather conditions (e.g., rainfall) or the pesticide application (e.g., decreased efficiency).
Initial pesticide residue data are only available for insecticides since the insecticides that were tested indicated greater acute risks to birds and mammals that consume arthropods than herbicides or fungicides. Therefore, analyses of initial insecticide residues were studied in order to quantify exposures to birds and mammals. It is assumed that the initial pesticide residue data set for arthropods obtained from insecticides is applicable to all classes of pesticides sprayed on fields. It is also assumed that initial residue levels are primarily influenced by application rate and the characteristics of the arthropod or plant material on which the pesticide is deposited. Longer-term concentrations, however, are likely influenced by a myriad of factors including the characteristics of the individual chemical, plant, and arthropod.
It should be noted that this analysis uses a different method for arriving at mean and upper-bound initial residue values for arthropods than was used for the plant food types used in T-REX, T-HERPS and TIM (derived from Fletcher et al. 1994).
-
References Cited
-
6.1 Scientific Literature
Bennett, R.S., E.E. Klaas, J.R. Coats and E.J. Kolbe (1986). Fenvalerate concentrations in the vegetation, insects, and small mammals of an old-field ecosystem. Bull. Environ. Contam. Toxicol. 36: 785-792.
Bennett, R.S., E.E. Klaas, J.R. Coats, M.A. Mayse and E.J. Kolbe (1983). Fenvalerate residues in non-target organisms from treated cotton fields. Bull. Environ. Contam. Toxicol. 31: 61-65.
Brewer, L.W., C.J. Driver, R.J. Kendall, T.E. Lacher and J.C. Galindo (1988). Avian response to a turf application of triumph 4E. Environ. Toxicol. Chem. 7: 391-401.
Brewer, L.W., H.L. McQuillen Jr, M.A. Mayes, J.M. Stafford, and S.L. Tank (2003). Chlorpyrifos residue levels in avian food items following applications of a commercial EC formulation to alfalfa and citrus. Pest Manag Sci., 59(11):1179-90.
Clements, R.O., J.S. Bale and C.A. Jackson (1988). An appraisal of methods used to assess the effect on birds and mammals of chlorpyrifos applied to grassland. In: Field methods for the study of environmental effects of pesticides. BCPC Monograph 40: 57-62.
Davis, B. N. K. and French, M. C. 1969. The Accumulation and Loss of Organochlorine Insecticide Residues by Beetles, Worms, and Slugs in Sprayed Fields. Soil Biol. Biochem. 1, 45-55.
Davis. 1968. The soil macrofauna and organochlorine insecticide residues at twelve agricultural sites near Huntingdon. Ann Appl Biol 61, 29-45.
Davis and Harrison. 1966. Organochlorine insecticide residues in soil invertebrates. Nature, Lond. 211, 1424-1425.
DeReede, R.H. (1982). A field study on the possible impact of the insecticide diflubenzuron on insectivorous birds. Agro-Ecosystems 7: 327-342.
ECOFRAM (1999). ECOFRAM Terrestrial Draft Report, 10 May 1999.
EPPO. (2003). Environmental risk assessment scheme for plant protection products. Chapter 11: Terrestrial vertebrates. EPPO Bulletin 33:147-149.
Fair, J.M., P.L. Kennedy and L.C. McEwen (1995). Effects of carbaryl grasshopper control on nesting killdeer in North Dakota. Environ. Toxicol. Chem. 14: 881-890.
Fischer, D.L. and L.M. Bowers. 1997. Summary of field measurements of pesticide concentrations in invertebrate prey of birds. Poster presented to Society of Environmental Toxicology and Chemistry. 18th Annual Meeting, San Francisco, CA.
Fletcher, J. S., J. E. Nellessen, and T. G. Pfleeger (1994). Literature review and evaluation of the EPA food-chain (Kenaga) nomogram, an instrument for estimating pesticide residues on plants. Environmental Toxicology and Chemistry. 13(9): 1383-1391.
Forsyth, D.J., and N.D. Westcott (1993). Carbofuran residues in grasshoppers and vegetation from aerially sprayed prairie pastures: Potential effects on wildlife. Environmental Toxicology and Chemistry, 13(2):299-306.
Forsyth, D.J. and P.A. Martin (1993). Effects of fenitrothion on survival, behavior, and brain cholinesterase activity of white-throated sparrows (Zonotrichia albicollis). Environ. Toxicol. Chem. 12: 91-103.
Hamilton, G.A., K. Hunter and A.D. Ruthven (1981). Inhibition of brain acetylcholinesterase activity in songbirds exposed to fenitrothion during aerial spraying of forests. Bull Environm Contam Toxicol 27, 856-863.
Hoerger, F., E. E. Kenaga (1972). Pesticide residues on plants: Correlation of representative data as a basis for estimation of their magnitude in the environment. Environmental Quality and Safety. 1: 9-28.
Kenaga, E. E. (1973). Factors to be considered in the evaluation of the toxicity of pesticides to birds in their environment. Environmental Quality and Safety. 2: 168-181.
Leighton, F.A., Wobeser, G.A. and H.G. Whitney. 1987. Pesticide poisoning in gulls. Can.Vet.J. 28: 108-109.
Levin, Forsyth, Fairbrother and Skinner. 1968. Impact on colonies of honey bees of ultra-low-volume (undiluted) malathion applied for control of grasshoppers. Journal of Economic Entomology. 61: 58-62.
Luttik, R. (2001). Residues of plant protection products on food ingested by birds and mammals. Exit Factsheets for the (eco)toxicological risk assessment strategy of the National Institute of Public Health and the Environment (RIVM).
Martin, P.A., D.L. Johnson and D.J. Forsyth. 1996. Effects of grasshopper-control insecticides on survival and brain acetylcholinesterase of pheasant (Phasianus colchicus) chicks. Env. Toxicol. Chem. 15(4), 518-524.
Powell, G.V.N. (1984). Reproduction by an altricial songbird, the red-winged blackbird, in fields treated with the organophosphate insecticide fenthion. Journal of Applied Ecology 21, 83-95.
Sokal, R.R. and F.J. Rohlf. 1995. Biometry, the Principles and Practice of Statistics in Biological Research. Freeman and Company, New York. 887 pp.
Stromborg, K.L., L.C. McEwen and T. Lamont (1984). Organophosphate residues in grasshoppers from sprayed rangelands. Chem. Ecol., 2:39-45.
Stromborg, K.L., W.N. Beyer, and E. Kolbe (1982). Diazinon residues in insects from sprayed tobacco. Chemistry in Ecology, 1: 93-97.
-
6.2 Registrant-submitted studies
MRID 41548801. Menkens, G.; Johnson, G.; Krueger, H.; et al. (1989). Monitor 4 Liquid Insecticide: A Residue Monitoring Study in Potatoes to Assess Exposure to Avian Species under Standard Agricultural Use Conditions in Idaho: Lab Project I.D.: 149-122: Report No. 99718. Unpublished study prepared by Wildlife International Ltd. 91 p.
MRID 41548802. Menkene, G.; Frey, L.; Johnson, G. (1989). Monitor 4 Spray: A Residue Monitoring Study in Sugar Beets to Assess Exposure to Avian Species under Standard Agricultural Use Conditions in California: Lab Project Number: 162-180. Unpublished study prepared by Wildlife International Ltd. 90 p.
MRID 41548803. Perritt, J.; Palmer, D.; Krueger, H.; et al. (1990). An Evaluation of Its Effects upon Birds and other Wildlife on and around Cotton Fields in East-central Alabama: Wildlife International Ltd. Project No.: 162-185. Unpublished study prepared by Wildlife International Ltd. 261 p.
MRID 41585001. Pebworth, J.; Palmer, D.; Krueger, H.; et al. (1990). Monitor 4 Liquid Insecticide: An Evaluation of its Effects upon Birds and other Wildlife on and around Cabbage Fields in East-central Wisconsin: Wildlife International Ltd. Project No.: 149-146. Unpublished study prepared by Wildlife International Ltd. 360 p.
MRID 41785102. Wilkinson, C. (1991). Residues of Dicofol, Dicofol Metabolites and DDE in Selected Environmental Matrices: California, 1989: Lab Project Numbers: 23.7130.89.4; 38044; 1186. Unpublished study prepared by Versar, Inc. in coop. with ABC Labs and others. 2402 p.
MRID 41785103. Wilkinson, C. (1991). Residues of Dicofol, Dicofol Metabolites and DDE in Selected Environmental Matrices: Florida, 1989: Lab Project Numbers: 23.7130.89.5: 38130: 1186. Unpublished study prepared by Versar, Inc. in coop. with ABC Labs, Inc. and others. 3120 p.
MRID 42285501. Wilkinson, C. (1992). Residues of Dicofol, Dicofol Metabolites and DDE in Selected Environmental Matrices: New York, 1991: Lab Project Number: 91TR-6: 90RC- 271: 39478. Unpublished study prepared by ABC Labs, Analytical Development Corp., Huntingdon Analytical Services and Wildlife International Ltd. 2941 p.
MRID 42285503. Wilkinson, C. (1992). Residues of Dicofol, Dicofol Metabolites and DDE in Selected Environmental Matrices: California, 1991: Lab Project Number: 91TR-5: 90RC- 273: 39473. Unpublished study prepared by ABC Labs, Analytical Development Corp., Huntingdon Analytical Services and Wildlife International Ltd. 2732 p.
MRID 42437301. Wilkinson, C. (1992). Residues of Dicofol, Dicofol Metabolites and DDE in Selected Environmental Matrices: Florida, 1991: Lab Project Number: 90RC-275: 91TR-7. Unpublished study prepared by Technology Services Group. 3385 p.
MRID 42721301. Wilkinson, C. (1993). Residues of Dicofol, Dicofol Metabolites and DDE in Selected Environmental Matrices: New York, 1992: Lab Project Number: 92TR-4: 92RC- 007: 40368. Unpublished study prepared by ABC Labs, Inc., Analytical Development Corp., Huntingdon Analytical Services and Wildlife International Ltd. 3042 p.
MRID 42791101. Brewer, L. (1993). Residue Levels in Soil-Dwelling Invertebrates, Plants and Soil Following Treatment with Fosthiazate (ASC-66824) Experimental Organophosphorus Nematicide: Final Report: Lab Project Number: 19-92-600: 09201. Unpublished study prepared by Ecotoxicology & Biosystems Assocs., Inc. 125 p.
MRID 43730301. Gallagher, S.; Palmer, D.; Krueger, H. (1994). Lorsban Insecticide: A Pilot Year Evaluation of its Effects Upon Avian and Mammalian Species On and Around Citrus Groves in California: Lab Project Number: 103-365: ES-2525: RES 92062. Unpublished study prepared by MVTL Labs, Inc. and Wildlife Int'l Ltd. 884 p.
MRID 44464201. Gagne, J.; Troup, R.; Henry, L. et al. (1998). Residues of AC 303,630 in Insects and Their Dissipation After Single Applications of Pirate Insecticide-Miticide to Cotton Under Field Conditions: Lab Project Number: ECO 95-127: 954-95-127: M 2307. Unpublished study prepared by American Cyanamid Co., McKenzie Labs., Inc. and Georgia Agri-Scientific, Inc. 230 p.
MRID 44644701. McQuillen, H.; Brewer, L.; Stafford, J. (1998). Determinations of Residues of Chlorpyrifos in Insects, Soil Invertebrates and Seed After a Single Application of Lorsban 4E Insecticide to Citrus: Lab Project Number: 079717: GH-C 4699. Unpublished study prepared by Ecotoxicology and Biosystems Associates, Inc. 135 p.
MRID 44644702. McQuillen, H.; Brewer, L.; Stafford, J. et al. (1998). Determinations of Residues of Chlorpyrifos in Insects, Soil Invertebrates and Seed After a Single Application of Lorsban 4E Insecticide to Alfalfa: Lab Project Number: 079716. Unpublished study prepared by Ecotoxicology and Biosystems Associates, Inc. 129 p.
MRID 44692401. McQuillen, H.; Tank, S.; Brewer, J. et al. (1998). Determination of Residues of Carbofuran in Insects, Soil Invertebrates, and Seeds After a Single Application of Furadan 4F Insecticide-Nematicide to Alfalfa: Final Report: Lab Project Number: 079715: A97-4664. Unpublished study prepared by Ecotoxicology and Biosystems Associates, Inc. 171 p.
MRID 44806601. Brewer, L.; Stafford, J.; Sullivan, J. (1998). An Evaluation of Supracide 2E Residues on Potential Avian Food Items Following its Application to Citrus: Final Report: Lab Project Number: 079506: 811-95: CYAL METHOD NO. 18. Unpublished study prepared by Ecotoxicology and Biosystems Associates, Inc. 181 p.
MRID 44875301. McQuillen, H.; Tank, S.; Brewer, L. et al. (1999). Determination of Residues of Carbofuran in Insects and Soil Invertebrates After a Single Application of Furadan 4F Insecticide-Nematicide to Corn at Planting: Lab Project Number: 079714: A97-4663. Unpublished study prepared by Ecotoxicology & Biosystems Associates, Inc. 155 p.
MRID 45135901. Brewer, L.; Stafford, J. (1998). An Evaluation of Fipronil Residues on Potential Avian Food Items Following Multiple Applications to Cotton: Final Report: Lab Project Number: 079512: US95VR: CYAL METHOD NO.16. Unpublished study prepared by Ecotoxicology and Biosystems Associates, Inc. 369 p.
MRID 46817024. Wolf, C. (2006). Residues in Arthropod Prey of Birds and Mammals After the Application of NNI 0001 SC 480 (Active Substance NNI 0001) in a German Vineyard: Final Report. Project Number: WFC/FS/011, E/308/2687/4. Unpublished study prepared by Bayer CropScience AG, Institute for Ecotoxicology. 89 p.
MRID 47699440. Wolf, C. (2004). Residues in Arthropod Prey of Birds and Mammals After Application of Confidor SL 200 (Active Substance Imidacloprid) in a German Pome Fruit Orchard. Project Number: E/308/2407/4, WFC/FS/008, M/000054/01/2. Unpublished study prepared by Bayer CropScience. 71 p.
MRID 47699441. Schabacker, J. (2007). Re-evaluation of the Residue Study: Residues in Arthropod Prey of Birds and Mammals After the Application of Confidor SL 200(Active Substance Imidacloprid) in a German Pome Fruit Orchard with Regard to the Diet of Blue Tits(Parus caeruleus). Project Number: RA07082, M/287185/01/2. Unpublished study prepared by RIFCon GmbH. 17 p.
-