Reducing Air Pollution from International Transportation
Transportation of goods across air, sea and land presents economic opportunities, and also creates significant environmental challenges, including from criteria air pollutants and greenhouse gases. EPA is working with our international partners to reduce the environmental impacts of rapidly increasing international trade.
The first section of this page discusses the growth of international trade and transportation. The second section describes how EPA is working to reduce air pollution from international transportation. Click the links below to learn more about this issue.
- Growth of International Trade and Transportation
- Reducing Air Pollution from International Transportation
- Additional Resources
Growth of International Trade and Transportation
The trade of goods among the world’s economies is not new. However, in recent years international trade has grown to unprecedented levels as a consequence of profound transformations in global patterns of manufacturing and related forms of economic activity. This evolving interconnectedness of global economic activity is reflected in the increasing share of national Gross Domestic Product (GDP) that is based on international trade in merchandise, as shown below.
| GDP | Merch.Trade, % of GDP | |||||
|---|---|---|---|---|---|---|
| Country | 1990 | 2000 | 2014 | 1990 | 2000 | 2014 |
| Brazil | $462 | $655 | $2,417 | 12% | 17% | 19% |
| China | $359 | $1,205 | $10,355 | 32% | 39% | 42% |
| France | $1,275 | $1,368 | $2,829 | 35% | 49% | 45% |
| Germany | $1,765 | $1,950 | $3,868 | 44% | 54% | 70% |
| India | $327 | $477 | $2,049 | 13% | 20% | 38% |
| Italy | $1,178 | $1,142 | $2,141 | 30% | 42% | 47% |
| Japan | $3,104 | $4,731 | $4,601 | 17% | 18% | 33% |
| Russia | $517 | $260 | $1,861 | n/a | 58% | 43% |
| UK | $1,093 | $1,555 | $2,989 | 37% | 41% | 40% |
| USA | $5,980 | $10,285 | $17,419 | 15% | 20% | 23% |
| Top 10 | $16,060 | $23,628 | $50,529 | n/a | 20% | 23% |
| World | $22,542 | $33,290 | $77,961 | 31% | 39% | 49% |
In general, the demand for international transport services is driven by global population and economic growth and the consequent need to carry raw materials and intermediate and finished products between centers of production and consumption.
 Source: UNCTAD, Review of Maritime Transport, 2015. (Click image to enlarge.)
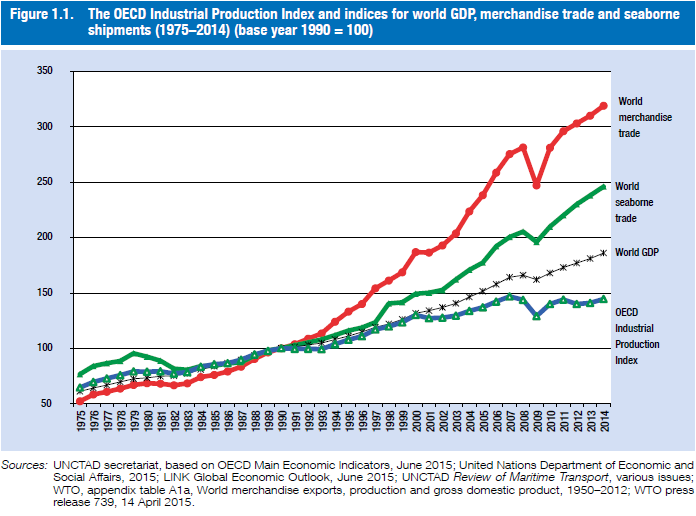
The figure to the right illustrates both the close correlation and the evolving relationship among economic growth, industrial activity, merchandise trade and maritime cargo transport during the period 1975-2014. Several changes during this time are noteworthy, including:
- The significant increase in the growth of seaborne trade volumes relative to global GDP and industrial activity reflects the development of more complex supply chains in conjunction with the advent of containerized shipping on scheduled routes among major world ports.
- The dramatic increase in the ratio of world merchandise trade to world GDP and industrial activity, and even to seaborne trade volumes, shows that even as more and more seaborne cargo is carried in standardized containers, international airfreight is used to move the highest-value and/or time-sensitive cargo.
- Much of the growth is driven by and based in the emerging developing economies such as Brazil, China, India and those of the Middle East.
In 2015 the International Transport Forum (ITF) projected that trade patterns will continue to shift geographically and that, as a consequence, global freight transport volumes will more than quadruple by 2050.
The next two illustrations show global shipping activity for calendar year 2012, derived from satellite tracking of vessels. Beyond showing the ubiquity of vessel traffic overall, the first illustration reveals key patterns and concentrations in the major types of vessels used to carry cargo . The lines in yellow refer to container ships, which increasingly carry more and more cargo that previously would have been carried, for example, in a bulk carrier. Dry bulk ships are shown in blue. Tankers (e.g. for oil) are in red. Gas bulk tankers are in green, and vehicle carriers are in magenta.
The second illustration shows global container ship traffic, and highlights the degree to which container ship traffic is driven by, and facilitates, the economic emergence of developing countries, particularly in Asia. The International Transport Forum stated in 2015 that “Expansion in Asia continues to determine global trade patterns, with intra-Asia containerized cargo flows now being more substantial than Asia-Europe and Asia-US flows together.”
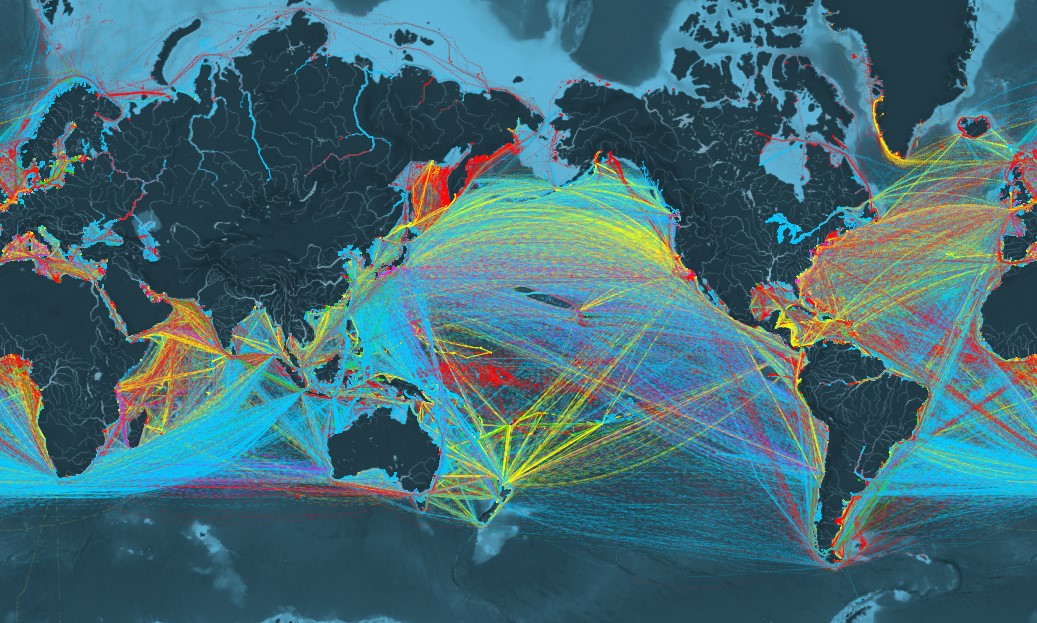 Source: ShipMap, Exit developed by University College, London and Kiln; IMO GHG Study 2014. (Click image to enlarge.)
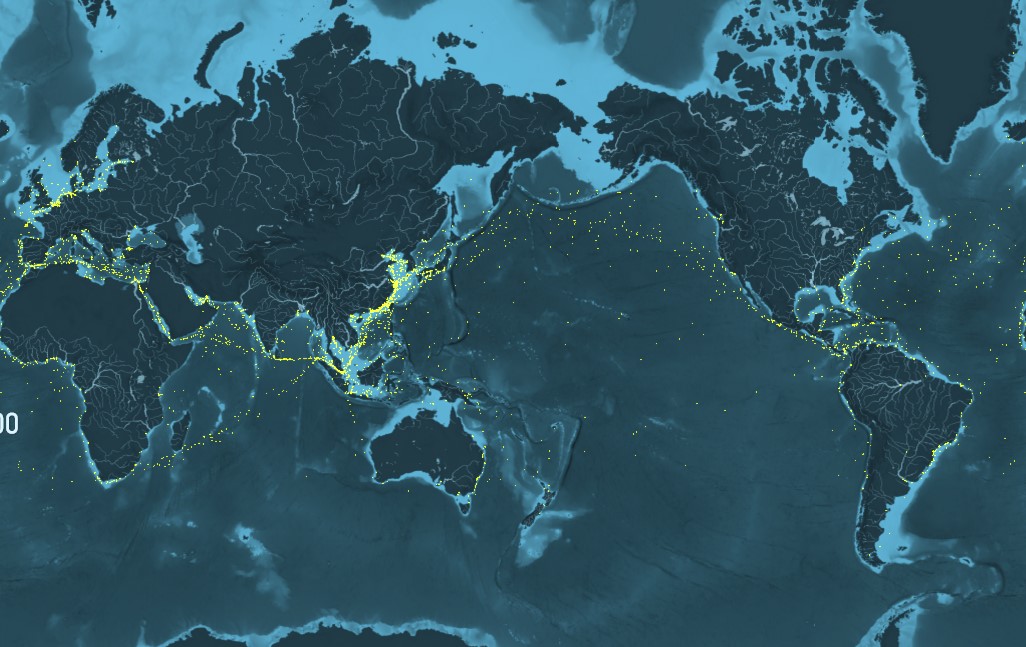 Source: ShipMap, Exit developed by University College, London and Kiln; IMO GHG Study 2014. (Click image to enlarge.)
The next illustration (below) shows the growth in tons of cargo transported by maritime shipping. From 1980 to 2014, international seaborne trade, measured in millions of tons of cargo loaded, grew 265 percent. Containerized shipping experienced dramatic growth, both in absolute quantities and also in relation to the cargo volumes carried in other types of ships.
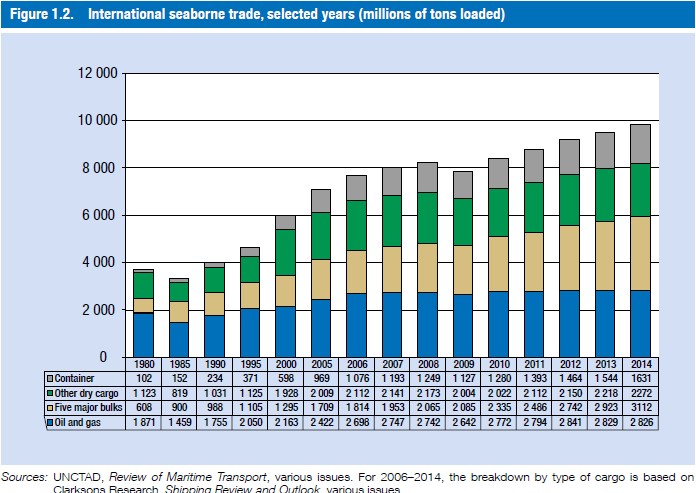 Sources: UNCTAD, Review of Maritime Transport, various issues. For 2006-2014, the breakdown by type of cargo is based on Clarksons Research, Shipping Review and Outlook, various issues. (Click image to enlarge.)
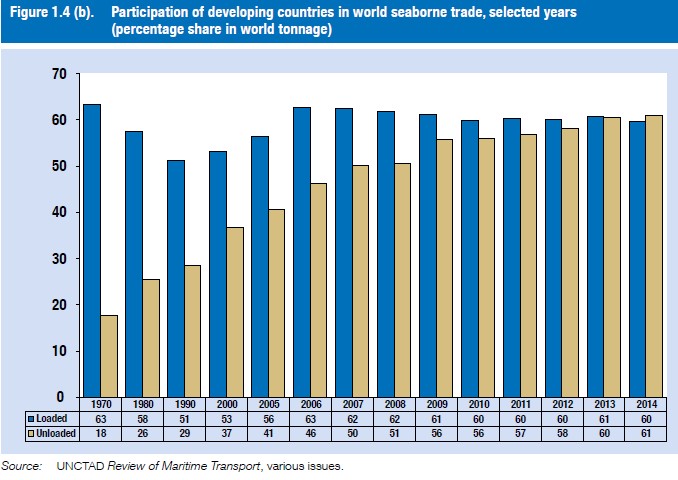 Source: UNCTAD Review of Maritime Transport, various issues. (Click image to enlarge.)
The next illustration (right) shows the shift in the relative share of cargo tonnage that is being loaded and unloaded in the sea-ports of developed and developing countries. In 1970 developing countries were responsible for 63 percent of all the cargo loaded at seaports, much of it in the form of unprocessed, low value-added resources, but only 18% of all the cargo unloaded at global seaports in that year. By 2014 developing countries around the world were responsible for about 60 percent of all cargo loaded, as well as unloaded, at seaports.
According to the International Transport Forum, “The traditional trade routes between developed economies will grow relatively slowly, whereas the growth of the trade corridors connecting emerging economies will average 17% annually. By 2050, the transport corridor between the United States and Asia will be subject to the highest flow of goods in both directions. By 2030, the North Pacific corridor will surpass the North Atlantic as the main freight corridor. Significant growth will also take place in the Indian Ocean and Mediterranean and Caspian Sea corridors.”
The next illustration (right, below) shows that world seaborne trade, measured in cargo ton-miles, almost doubled during the 2000 – 2015 time period. Given the developments in global trade patterns noted above, this is no surprise. With more countries—particularly those with emerging economies—participating in global trade, more cargo is being transported across greater distances. It is worth noting that containerized shipping almost tripled during this time period, compared to the more modest—but still significant—growth in cargo ton-miles for the other types of ships.
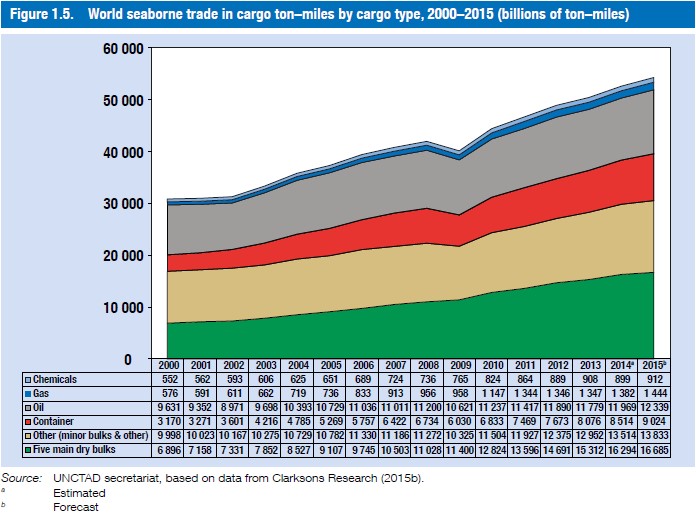 Source: UNCTAD secretariat, based on data from Clarsons Research (2015b). (Click image to enlarge.)
When goods are traded internationally, they can be moved over water, air or land. The transport choice depends on the geographic proximity of the trading partners, characteristics of the product to be transported, the relative costs of competing transport modes, and other key facilitating services such as communications.
- Seaborne transportation carries the majority of all goods traded internationally. Since the 1970s, seaborne trade has grown each year, and ships now carry almost 90% of all world trade by volume.
- Aviation, the dominant mode of international passenger transportation, is also a critical provider of rapid transportation for high-value and/or time-sensitive goods. Since 1970, the volume of cargo sent by air has increased to 35% of the value of world trade.
- In the case of neighboring countries, notably nations in Europe and North America, land-based modes (e.g. trucking, rail, pipelines) also move very large volumes of goods in trade.
Reducing Air Pollution from International Transportation
Because of their reliance on petroleum-based fuels and their dramatic growth rates in recent decades, air and sea transport are responsible for significant emissions of traditional (criteria) air pollutants (e.g. sulfur oxides (SOx), nitrogen oxides (NOx)) and greenhouse gases such as carbon dioxide (CO2) and other pollutants. The most recent estimate of air pollutant emissions from international shipping comes from the Third IMO GHG Study 2014. This study provided an analysis of emissions during the 2007-2012 time period, as well as projections out to 2050.
The IMO found that international shipping contributes about 13% and 12% of annual global NOx and SOx emissions, respectively, from anthropogenic sources reported in the latest IPCC Assessment Report (AR5). This sector contributed an average of 2.6% of global annual CO2 emissions from the combustion of fossil fuels during the period 2007 – 2012. (The figure for 2012 was 2.2%.) The IMO also found that shipping CO2 emissions are projected to increase by 50% to 250% in the period to 2050, despite fleet average efficiency improvements of about 40%, because of the expected growth in shipping activity. It is worth noting that, compared to other transport modes, international aviation and shipping have few options for transitioning to other, cleaner fuels in the near- to medium-term. By contrast, even with anticipated growth in shipping activity, international shipping’s contribution to global NOx and SOx emissions is expected to grow more slowly because of the application of binding IMO standards on marine fuel sulfur content, NOx emission controls for engines, and other measures.
EPA, industry and other entities in the U.S. and abroad have taken a number of regulatory and voluntary steps to reduce domestic emissions from maritime shipping and aviation. These efforts have resulted in some emissions reductions here and abroad. However, because of the very nature of these transportation modes (operating largely outside of national boundaries), domestic actions alone cannot control the energy consumption of, or emissions from, these sectors.
Reducing traditional “criteria” air pollutants (e.g. NOx, SOx, PM): Working internationally, the U.S. and other countries have established stringent marine fuel quality and engine emissions standards under the auspices of Annex VI of the IMO’s International Convention for the Prevention of Pollution from Ships (MARPOL). By acting through the IMO, the specialized agency for maritime affairs within the United Nations system, we have achieved important reductions in maritime emissions of criteria air pollutants, while avoiding distortions or disruptions of international trade patterns.
Reducing greenhouse gas emissions (GHGs) and saving energy: In recent decades, industry and government have managed to improve the energy efficiency of ships and airplanes to a considerable degree. This has been driven by many factors, including the improvements in efficiencies of scale associated with the increasing size/capacity of ships and airplanes, engine and navigational routing improvements, and a desire to address higher fuel prices. EPA, other governmental entities, and key industry players have been working on this via internal development of new technologies, voluntary partnerships, and coordinated action undertaken in the technical agencies responsible for international maritime and aviation matters within the United Nations system: the IMO and the International Civil Aviation Organization (ICAO). However, there remains considerable potential for using technical and operational measures to further reduce energy consumption (and thus, emissions) from both ships and airplanes.
This challenge to meeting air quality and climate mitigation targets holds even after accounting for the global economic downturn that began in late 2008. Thus, the U.S. is partnering internationally to establish binding, globally-applicable policies to limit emissions from these transport sectors while avoiding undesirable trade distortions or constraints.
Additional Resources
- Explore EPA's Role in International Climate Adaptation.
- EPA's Ocean Vessels and Large Ships and Ports Initiative pages: Information about our achievements in controlling traditional air pollution emissions from maritime shipping that affect U.S. air quality, as well as our work in the IMO on these pollutants.
- Learn more about the North American ECA, the US Caribbean ECA, and our Collaboration with Mexico to Reduce Emissions from Ships.
- EPA's Aircraft page: Our achievements in controlling traditional air pollution emissions from aviation sources.
- A voluntary toolkit Exit assists ports wishing to quantify and control emissions of criteria pollutants and greenhouse gases from their operations. This toolkit was developed by leading ports in the U.S. and other countries, through the International Association of Ports and Harbours,
- The U.S. Coast Guard’s IMO web page has information about the U.S. delegation at IMO and its work with MEPC and other committees.
- The U.S. State Department Climate Page highlights a range of U.S.-initiated climate policies and partnerships.
- International Climate Partnerships: describes international climate-related efforts in which the United States is engaged.
References cited on this page:
UNCTAD (2015). Review of Maritime Transport 2015. United Nations publication. Sales No. E.15.II.D.5. New York and Geneva. Available at http://unctad.org/en/PublicationsLibrary/rmt2015_en.pdf (accessed 21 June 2016).
Dr. Edmund Hughes, IMO’s technical cooperation and capacity building work to support the implementation of international regulations on energy efficiency for ships, ICAO/IMO Side Event, UNFCCC COP 21, 2 December 2015
Third IMO GHG Study 2014; International Maritime Organization (IMO) London, UK, June 2014; Smith, T. W. P.; Jalkanen, J. P.; Anderson, B. A.; Corbett, J. J.; Faber, J.; Hanayama, S.; O'Keeffe, E.; Parker, S.; Johansson, L.; Aldous, L.; Raucci, C.; Traut, M.; Ettinger, S.; Nelissen, D.; Lee, D. S.; Ng, S.; Agrawal, A.; Winebrake, J. J.; Hoen, M.; Chesworth, S.; Pandey, A.
International Transport Forum (ITF), ITF 2015 Annual Summit.
Contacts
Joe Ferrante
U.S. Environmental Protection Agency
Office of International and Tribal Affairs (2670R)
1200 Pennsylvania Ave., NW
Washington, DC 20460
E-mail: ferrante.joe@epa.gov